Features

Everything your Mac is doing, in one place.

Cortex replaces Activity Monitor with apps you recognise, a month of history, and the Apple Silicon detail other monitors leave out.

01

The basics, done properly

Apps instead of processes, a month of memory, and alerts that know what normal looks like.

Overview

Apps, not processes

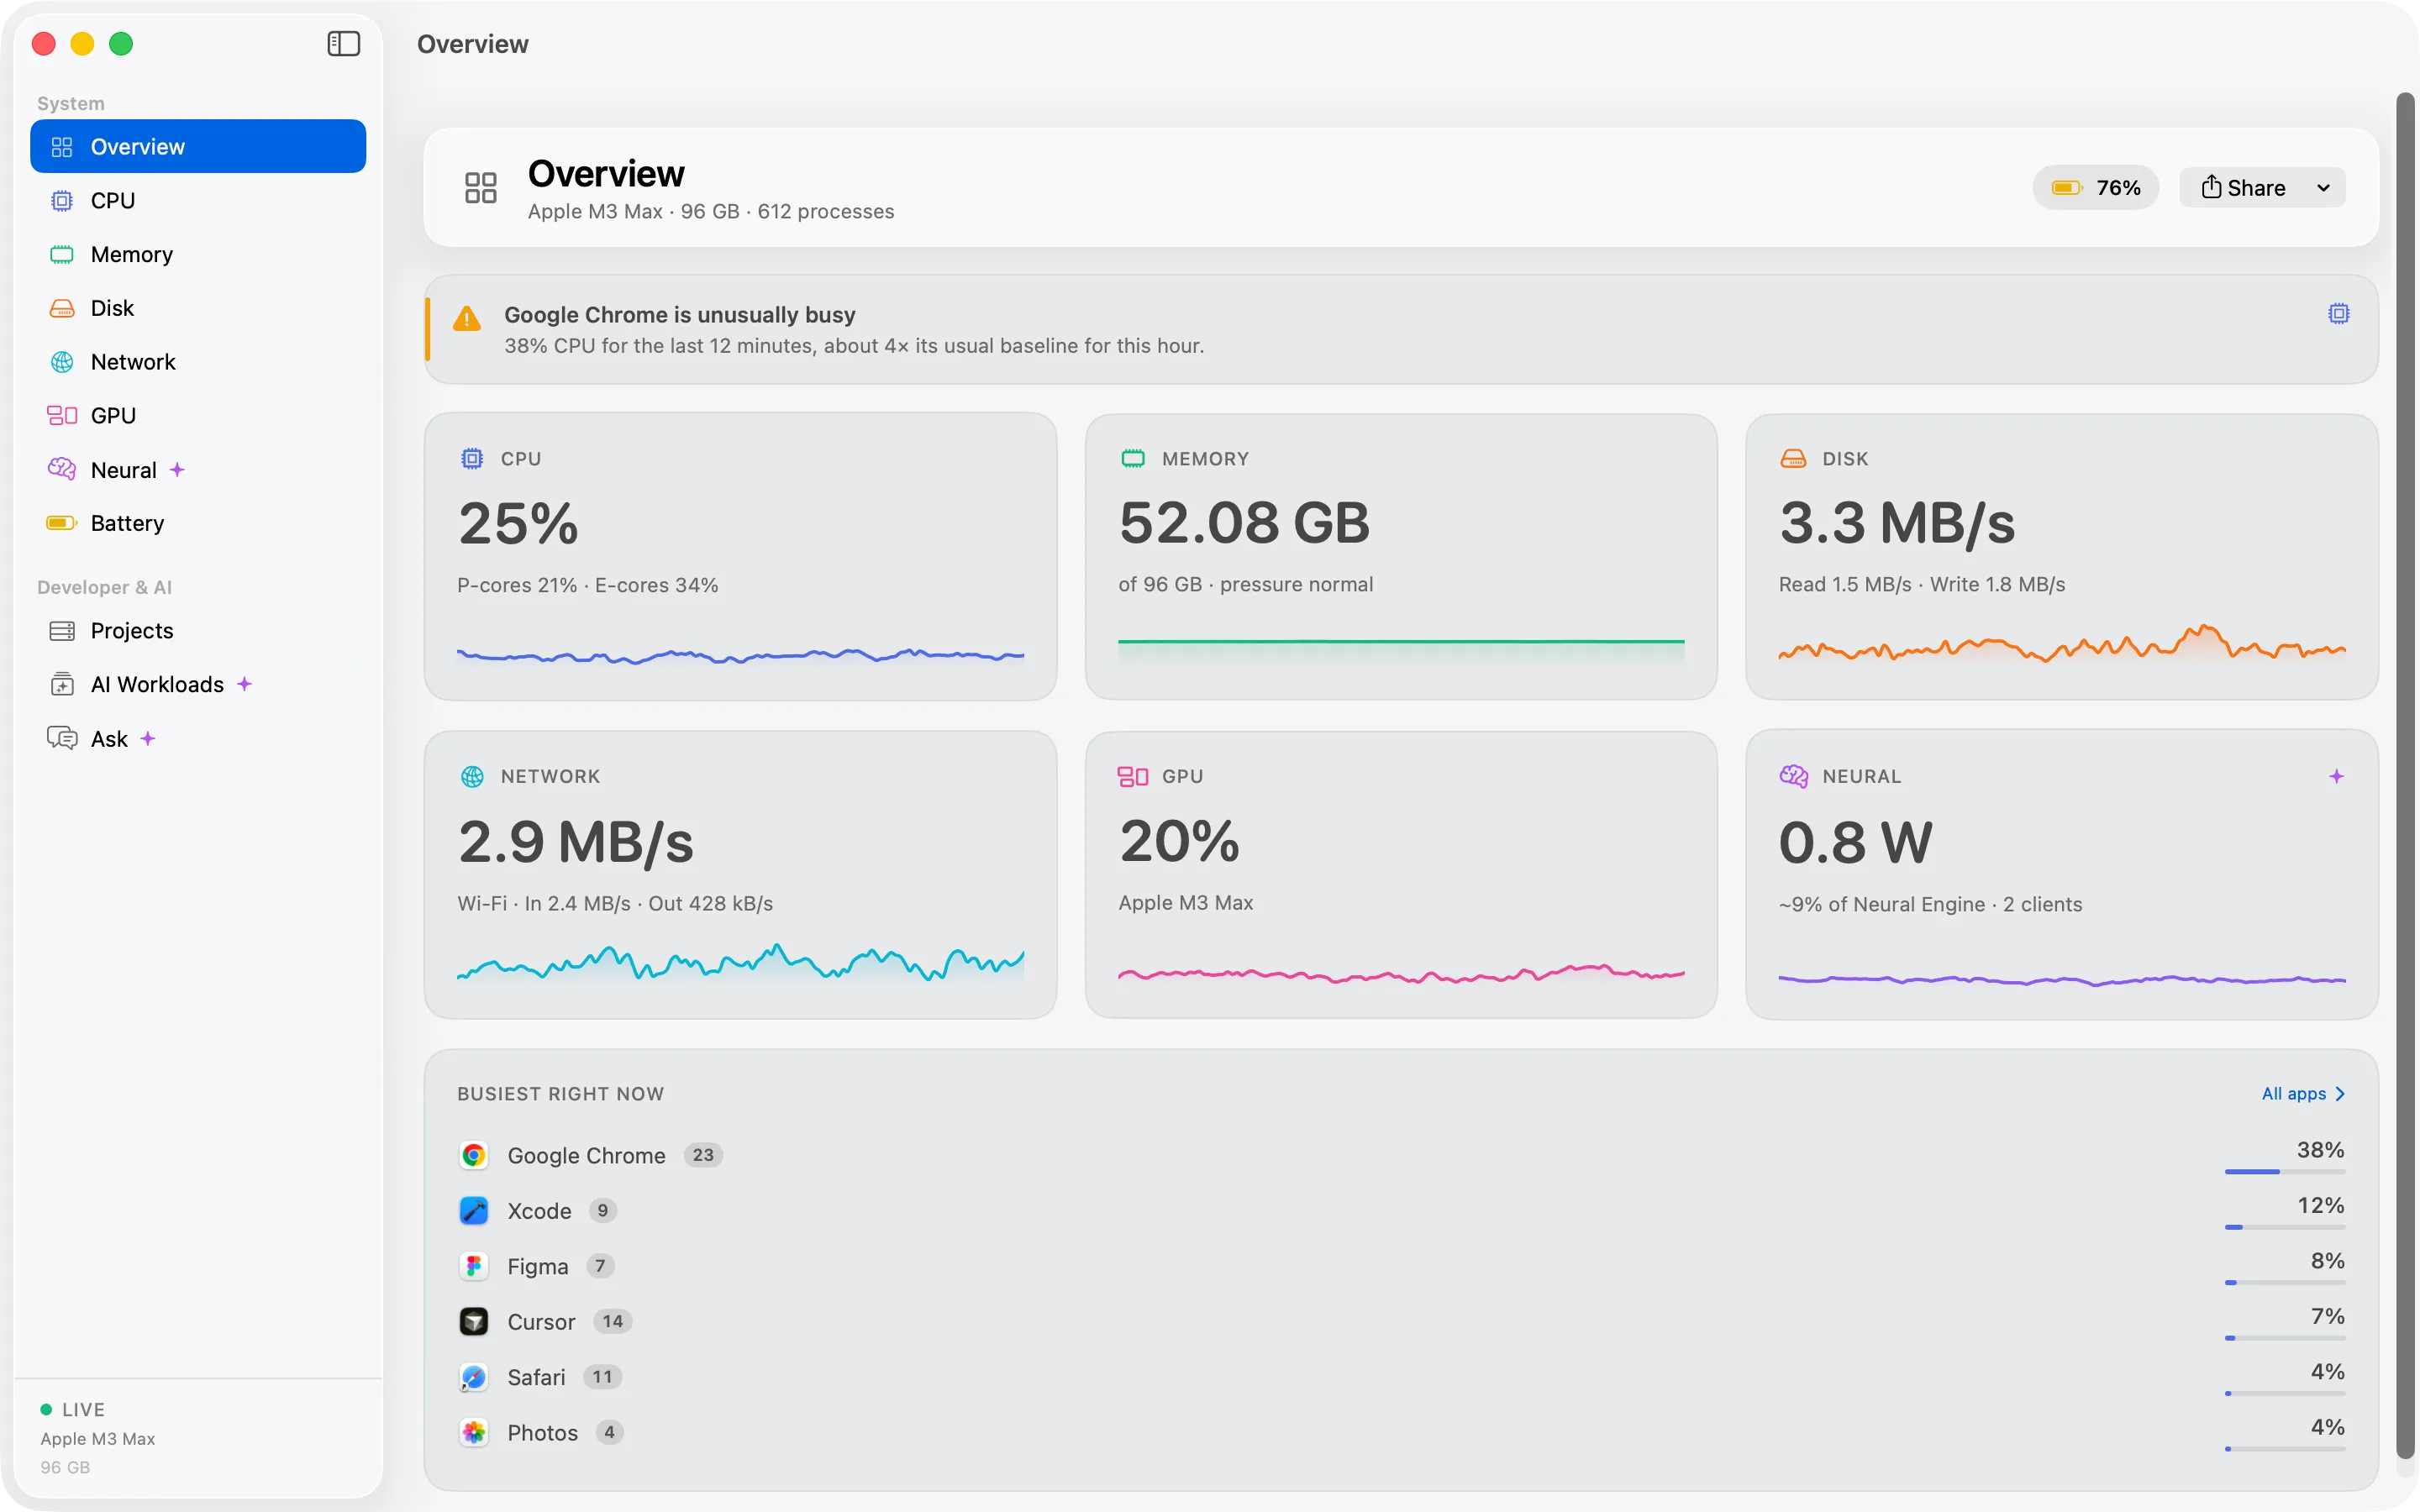
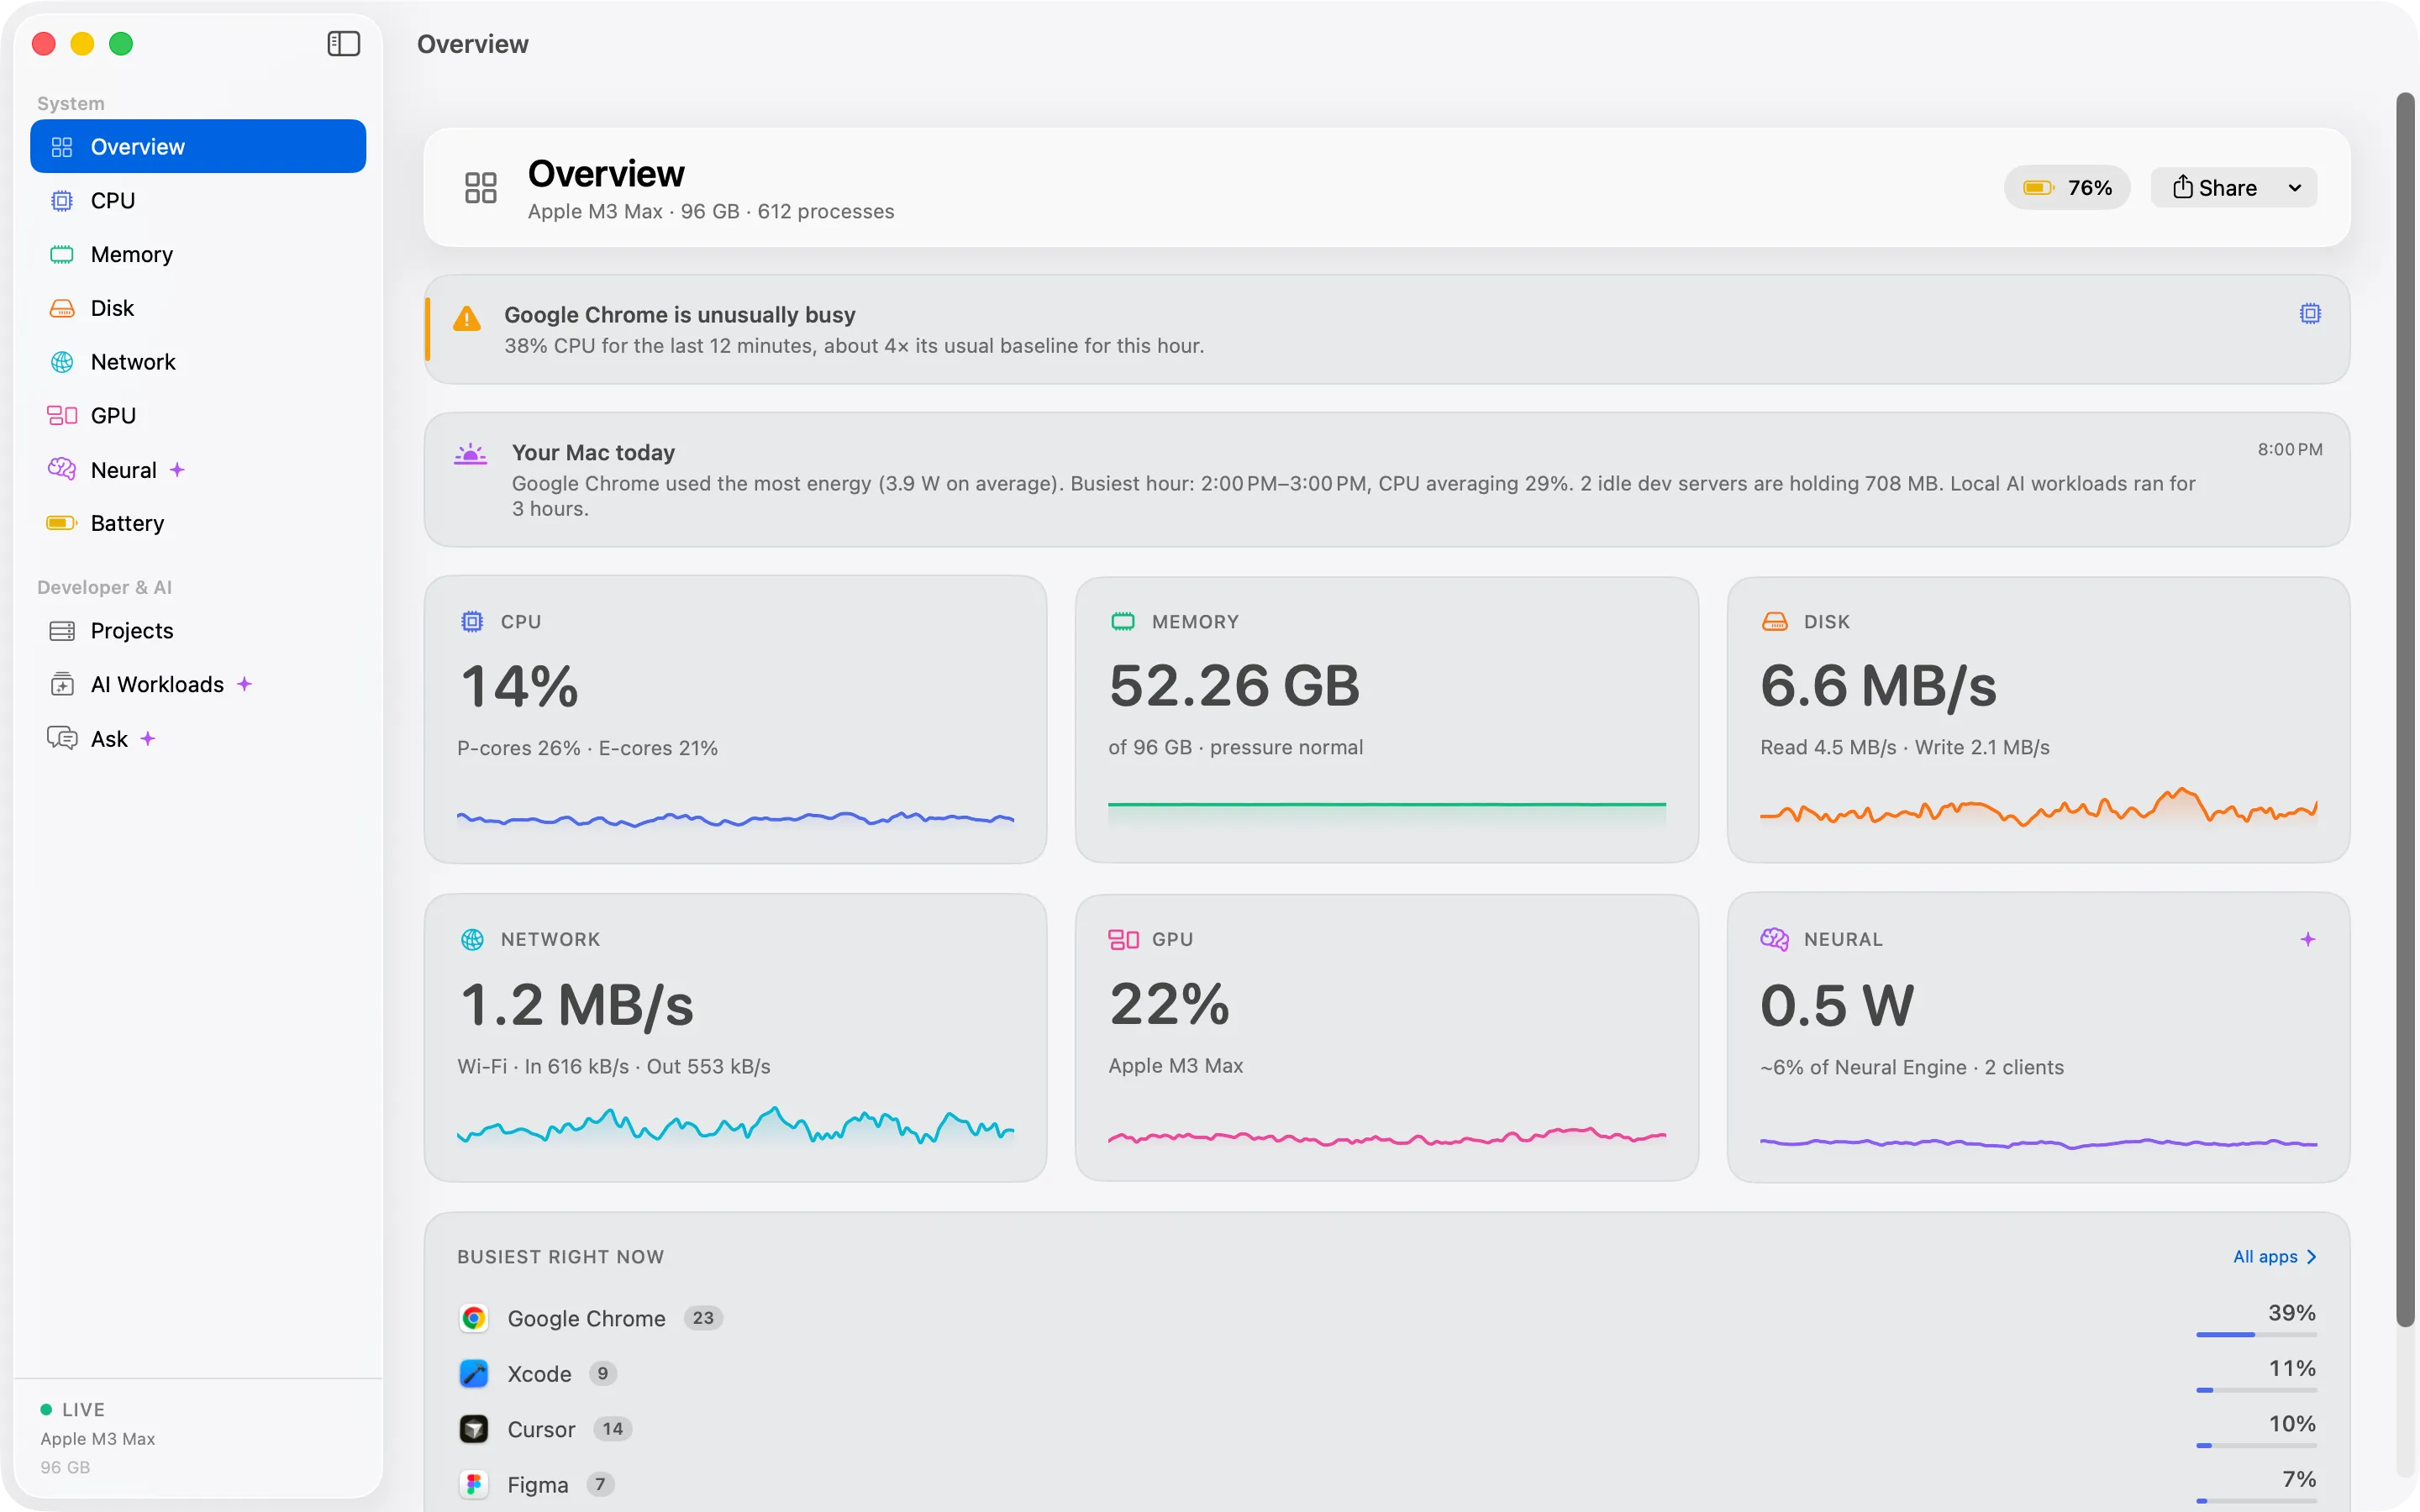
Cortex groups about 1,000 processes under the 60 or so apps they belong to. You see Chrome, not 40 helpers.

Activity Monitor shows you what the kernel sees. Cortex shows you what you actually run. Every helper, renderer and background agent is counted under its parent app, so a slow Mac has a name you recognise.

When you need the detail, expand the app and every process is still there.

  • CPU, memory, energy, disk and network per app
  • Expand any app to see its individual processes
  • Quit or Force Quit, always with a confirmation
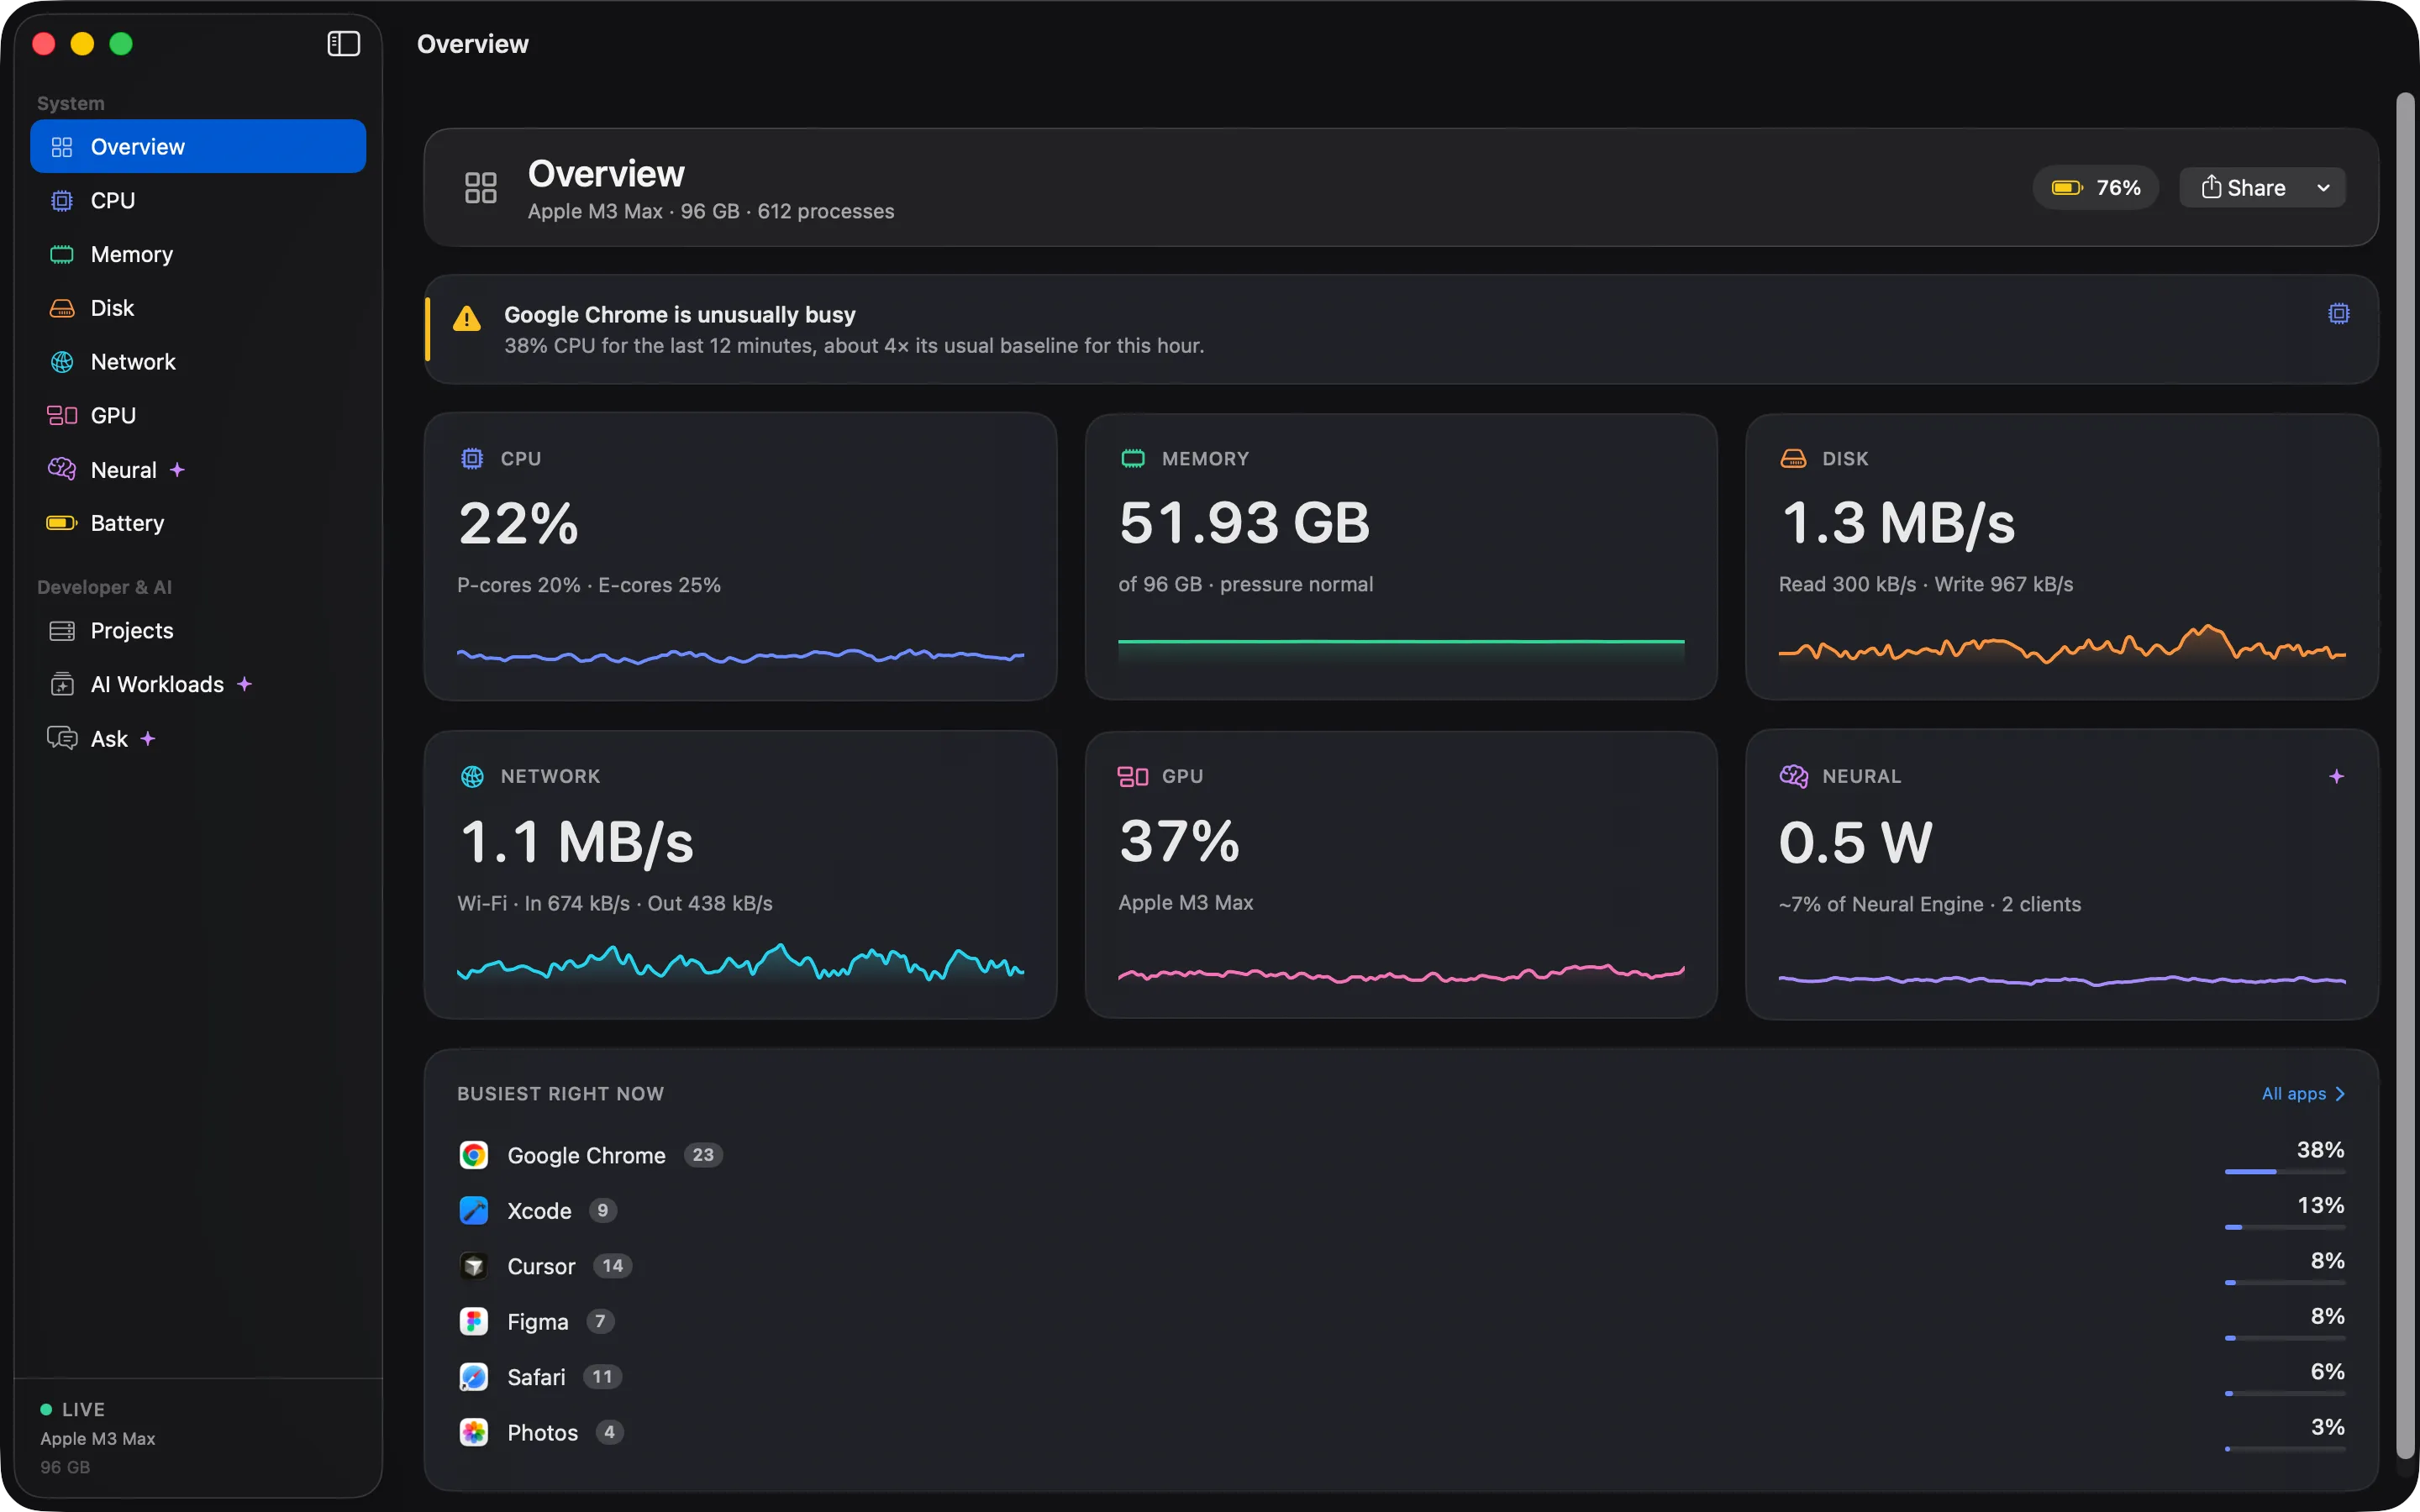
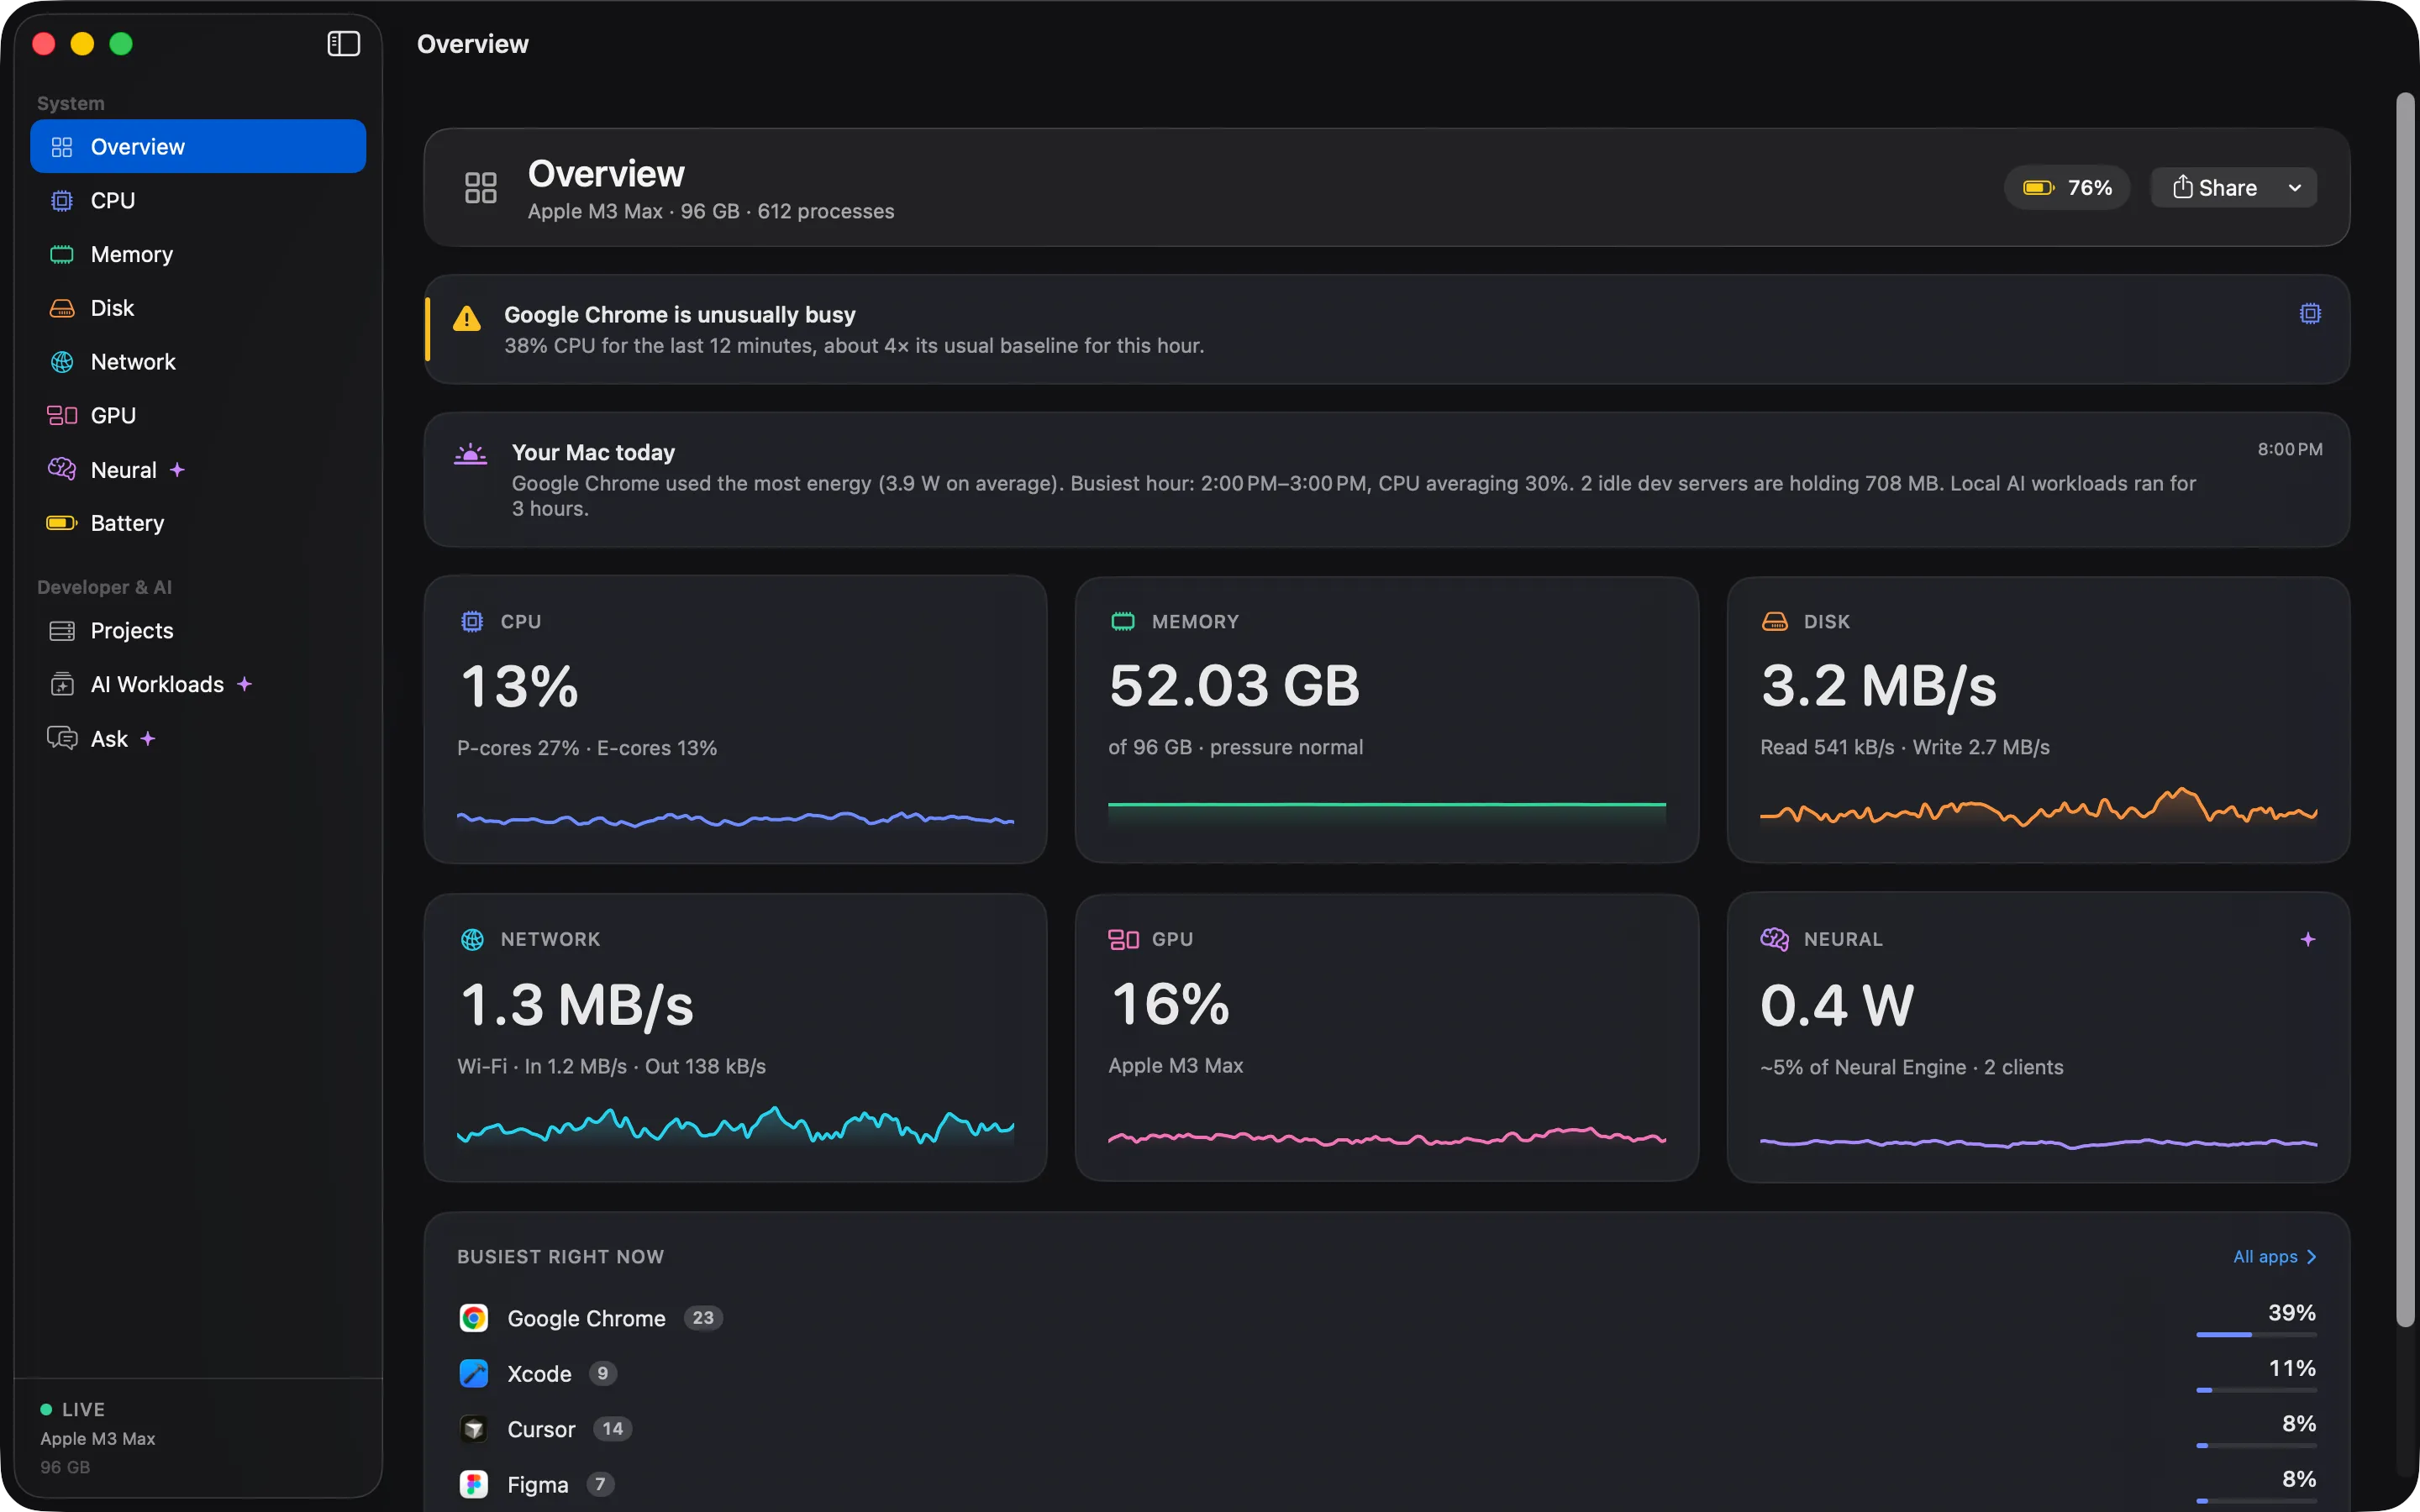
The Cortex overview window listing apps with their CPU, memory, energy, disk and network use.The Cortex overview window listing apps with their CPU, memory, energy, disk and network use.

History

30 days of history

Every metric, for every app, kept for 30 days. Find out what happened while you were away.

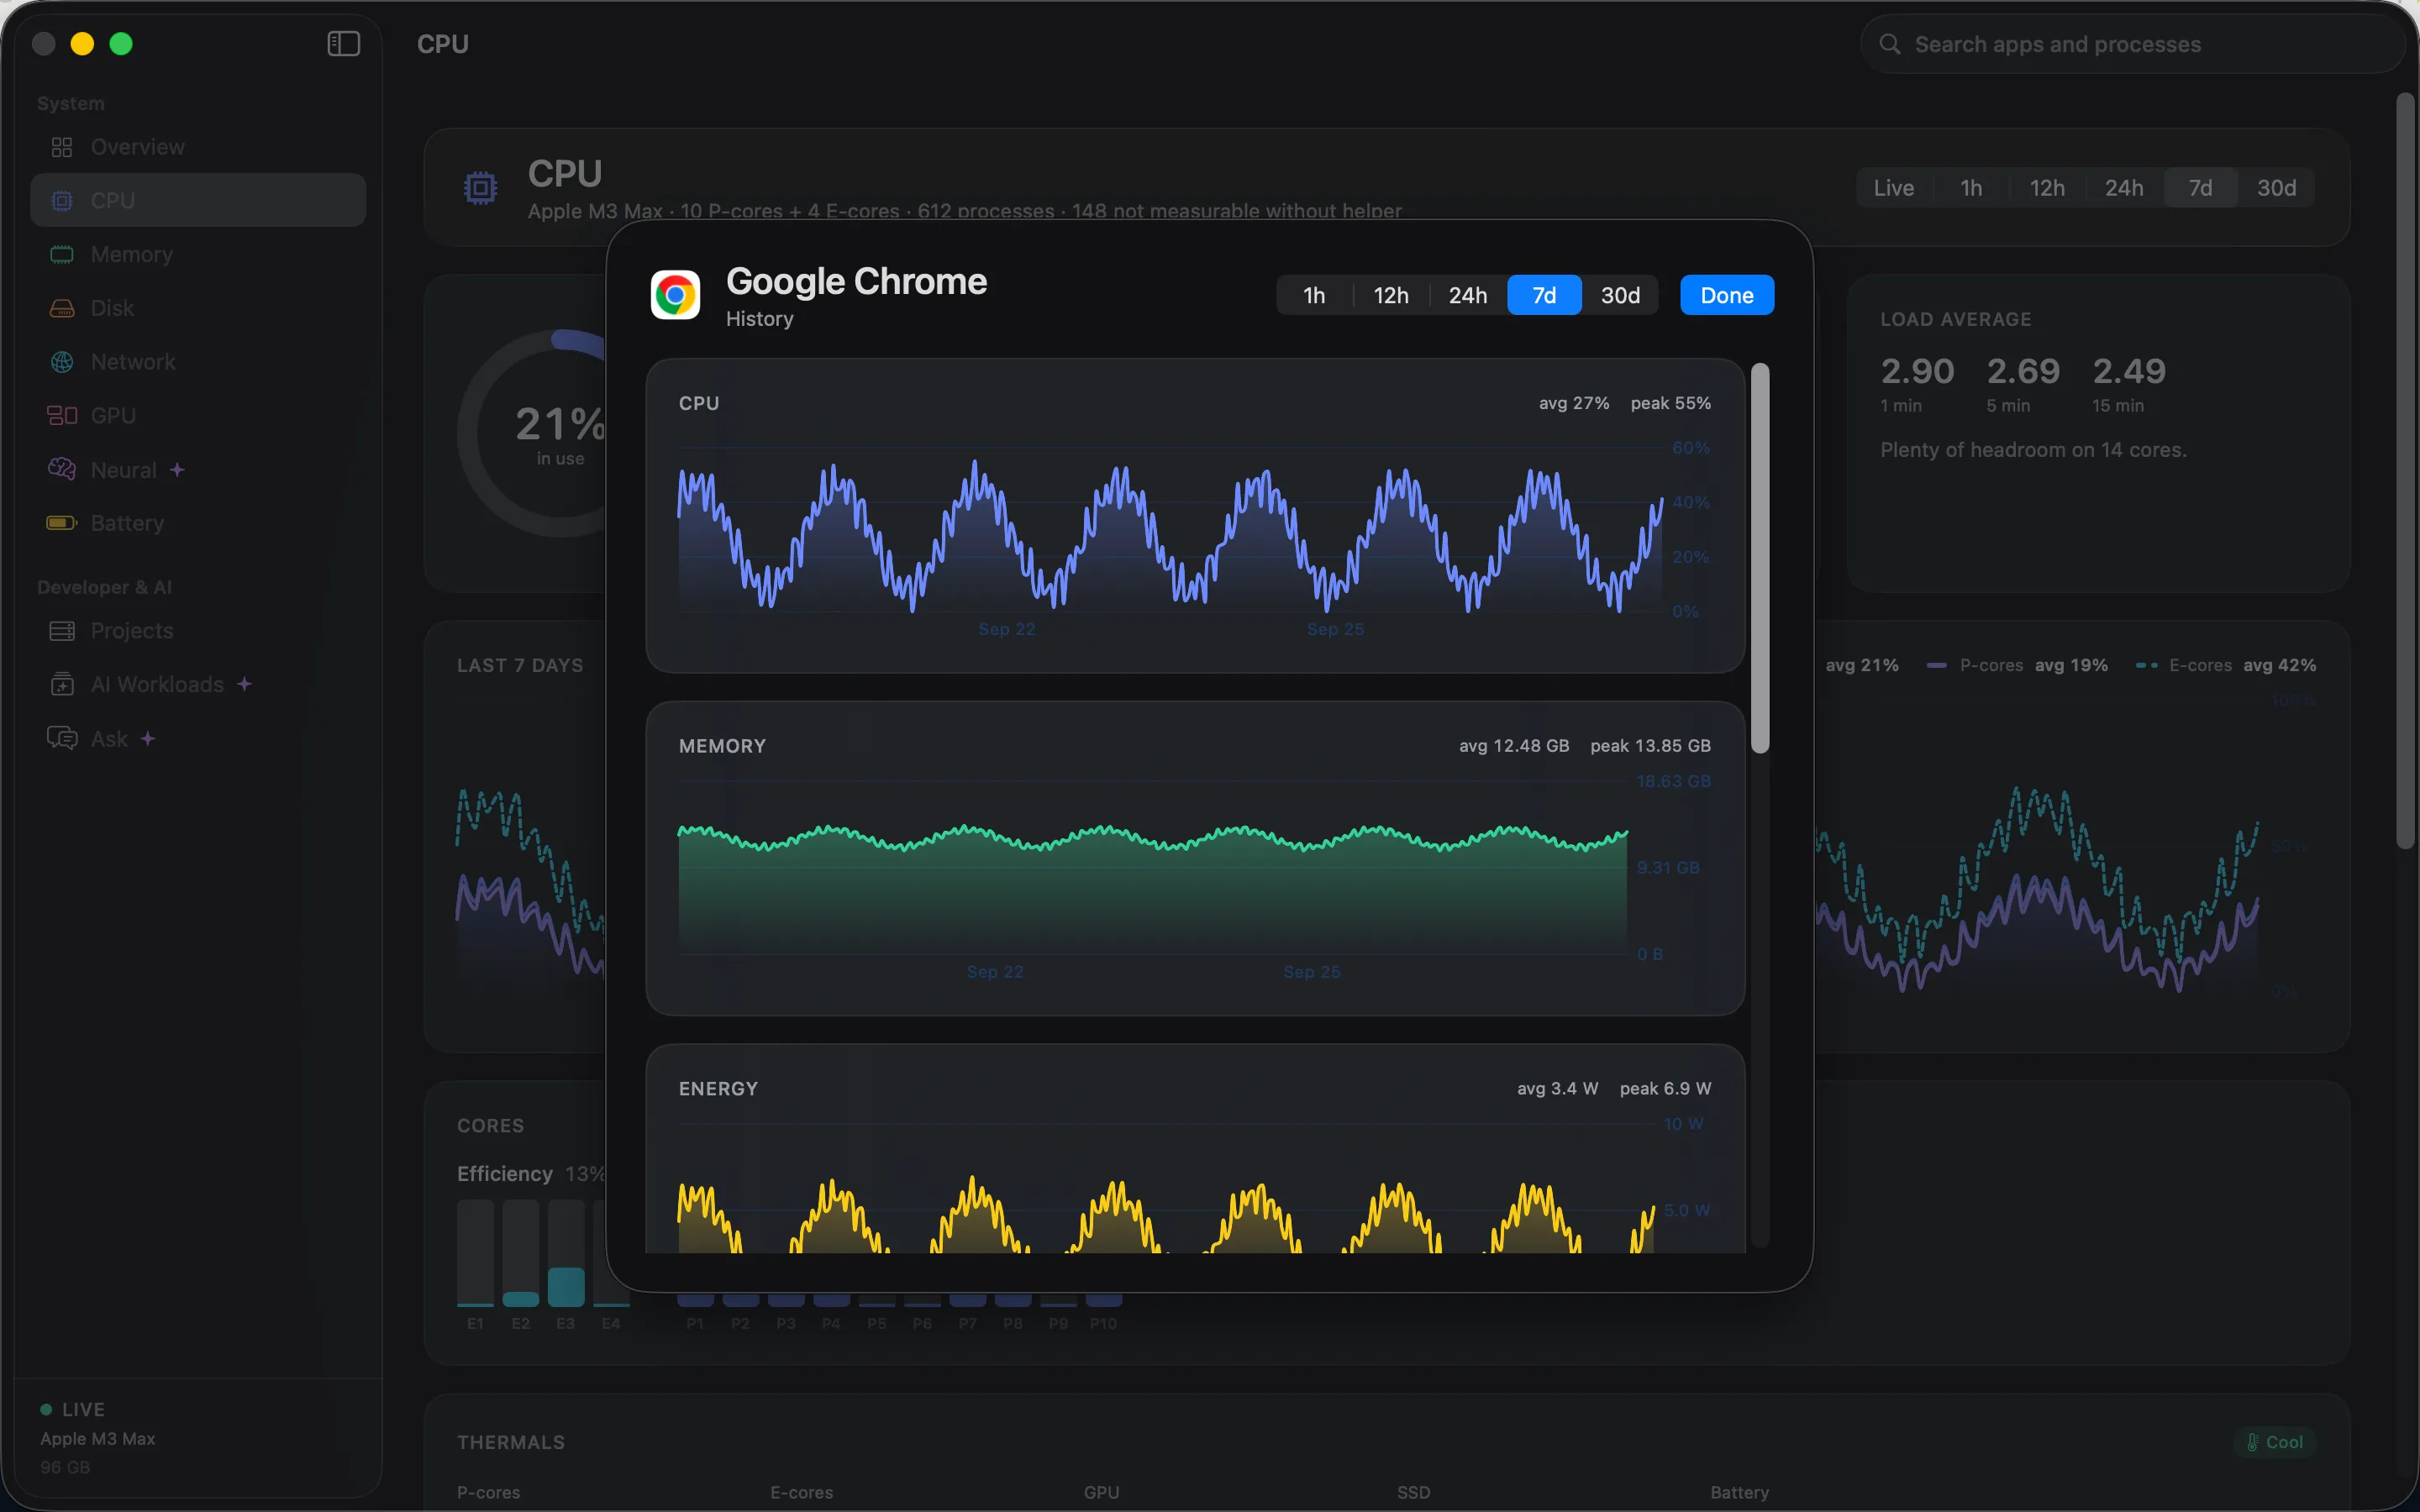
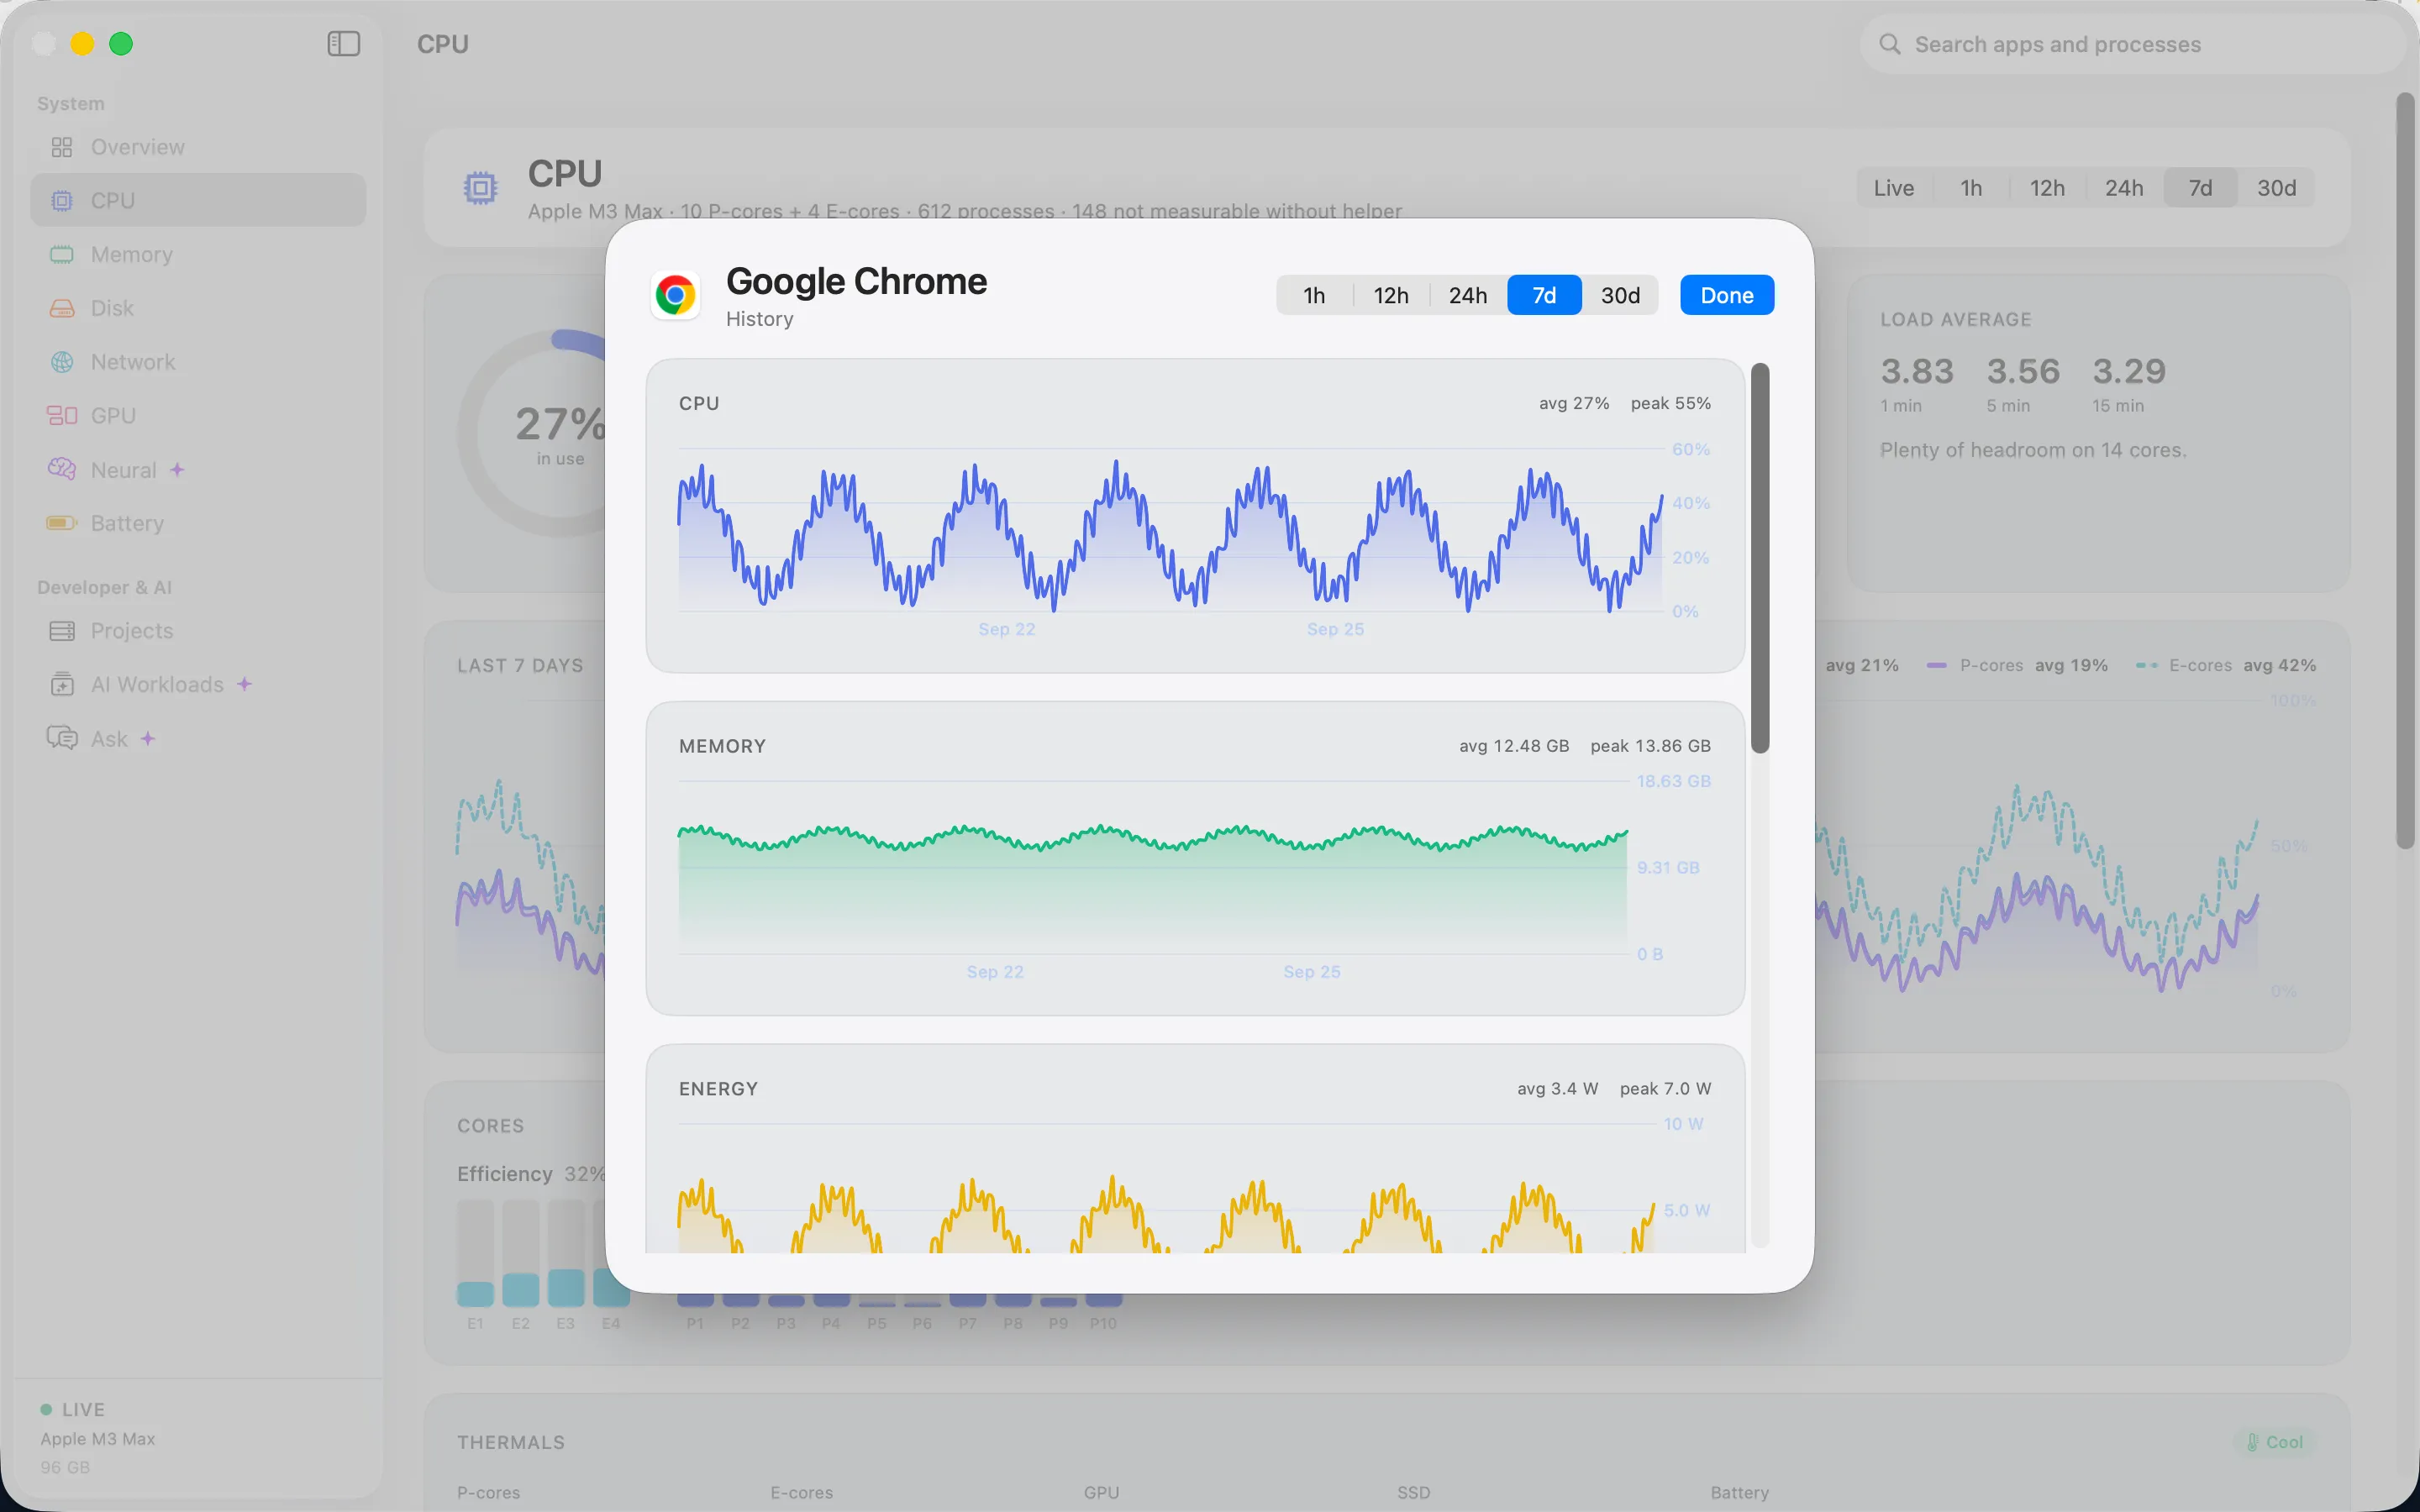
Activity Monitor forgets everything the moment you close it. Cortex keeps a month of data for every metric and every app, so “it was slow yesterday afternoon” becomes a chart you can read.

  • Ranges of 1 hour, 12 hours, 24 hours, 7 days and 30 days
  • Per-app history, not only system totals
  • Stored on your Mac, never uploaded
A Cortex history chart showing memory use for one app over the last seven days.A Cortex history chart showing memory use for one app over the last seven days.

Alerts

Smart alerts

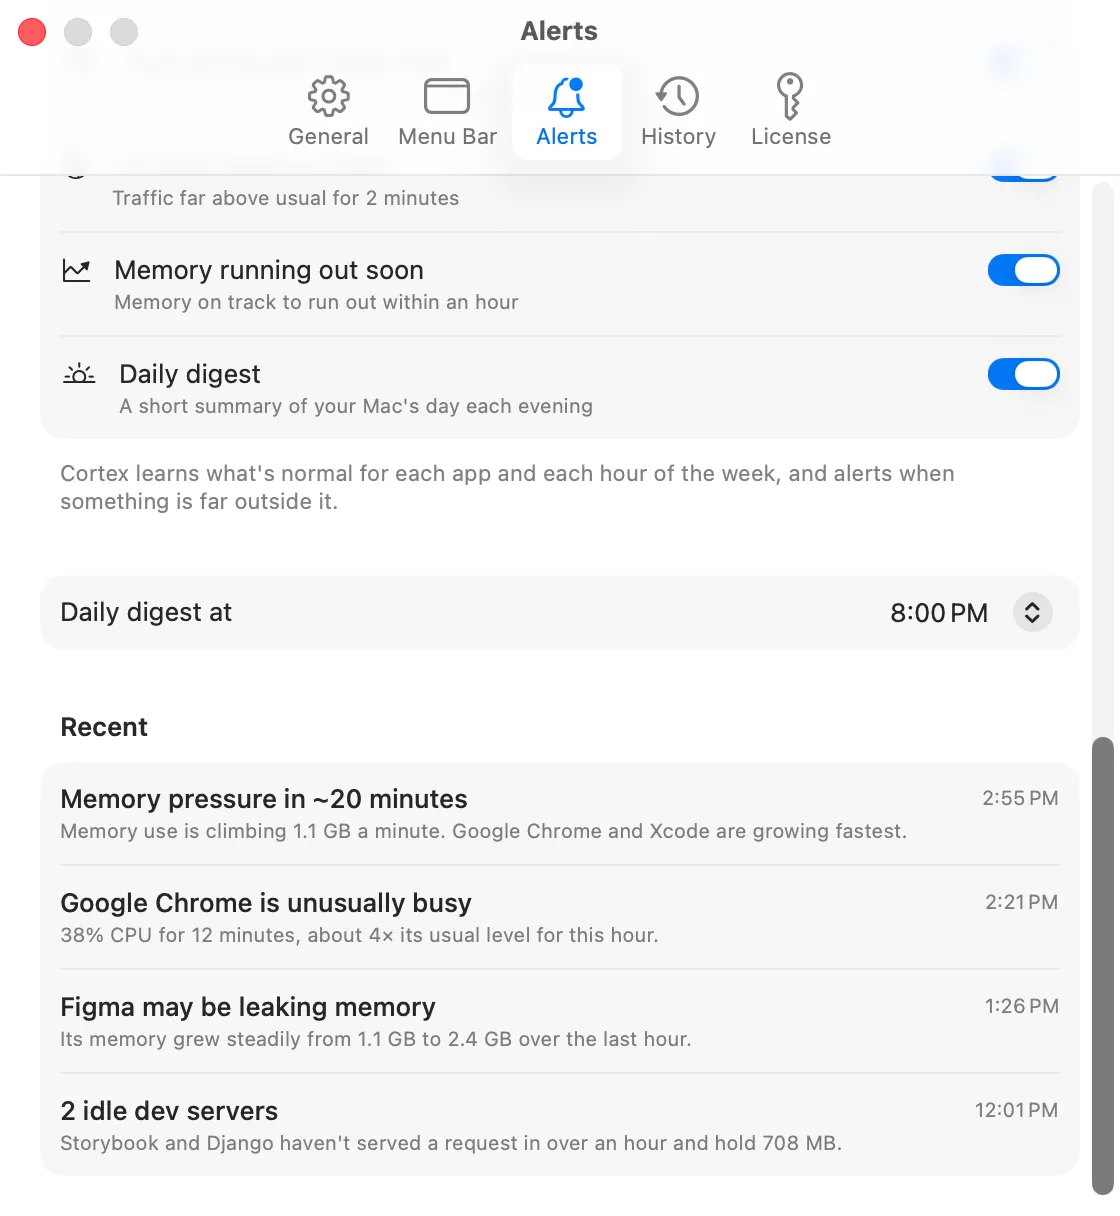
Cortex learns what is normal for each app at each hour of the week, and tells you when something is not.

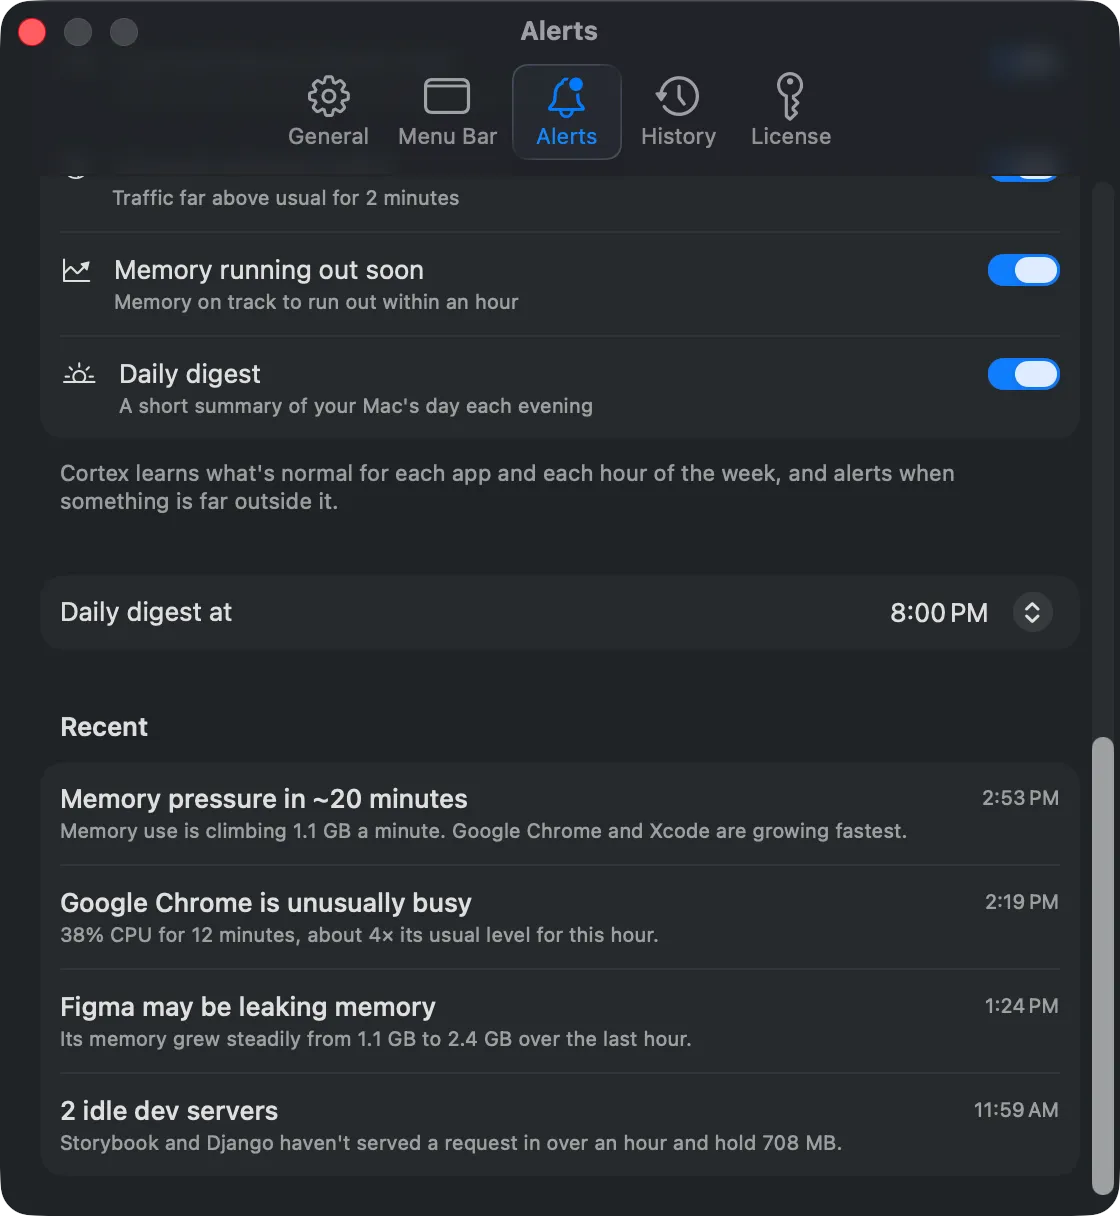
A fixed threshold is either too noisy or too late. Cortex builds a baseline for every app and every hour of the week, then alerts on what is unusual for that app, at that time.

  • Sustained CPU, memory leaks, disk and network hammering
  • GPU and Neural Engine spikes
  • Forecasts such as "memory pressure in about 20 minutes"
  • Snooze alerts per app
A Cortex notification warning that an app has used high CPU for 20 minutes.A Cortex notification warning that an app has used high CPU for 20 minutes.
02

Apple Silicon and local AI

The Neural Engine, the models you run, and whether the next one will fit.

Apple Silicon

Neural Engine

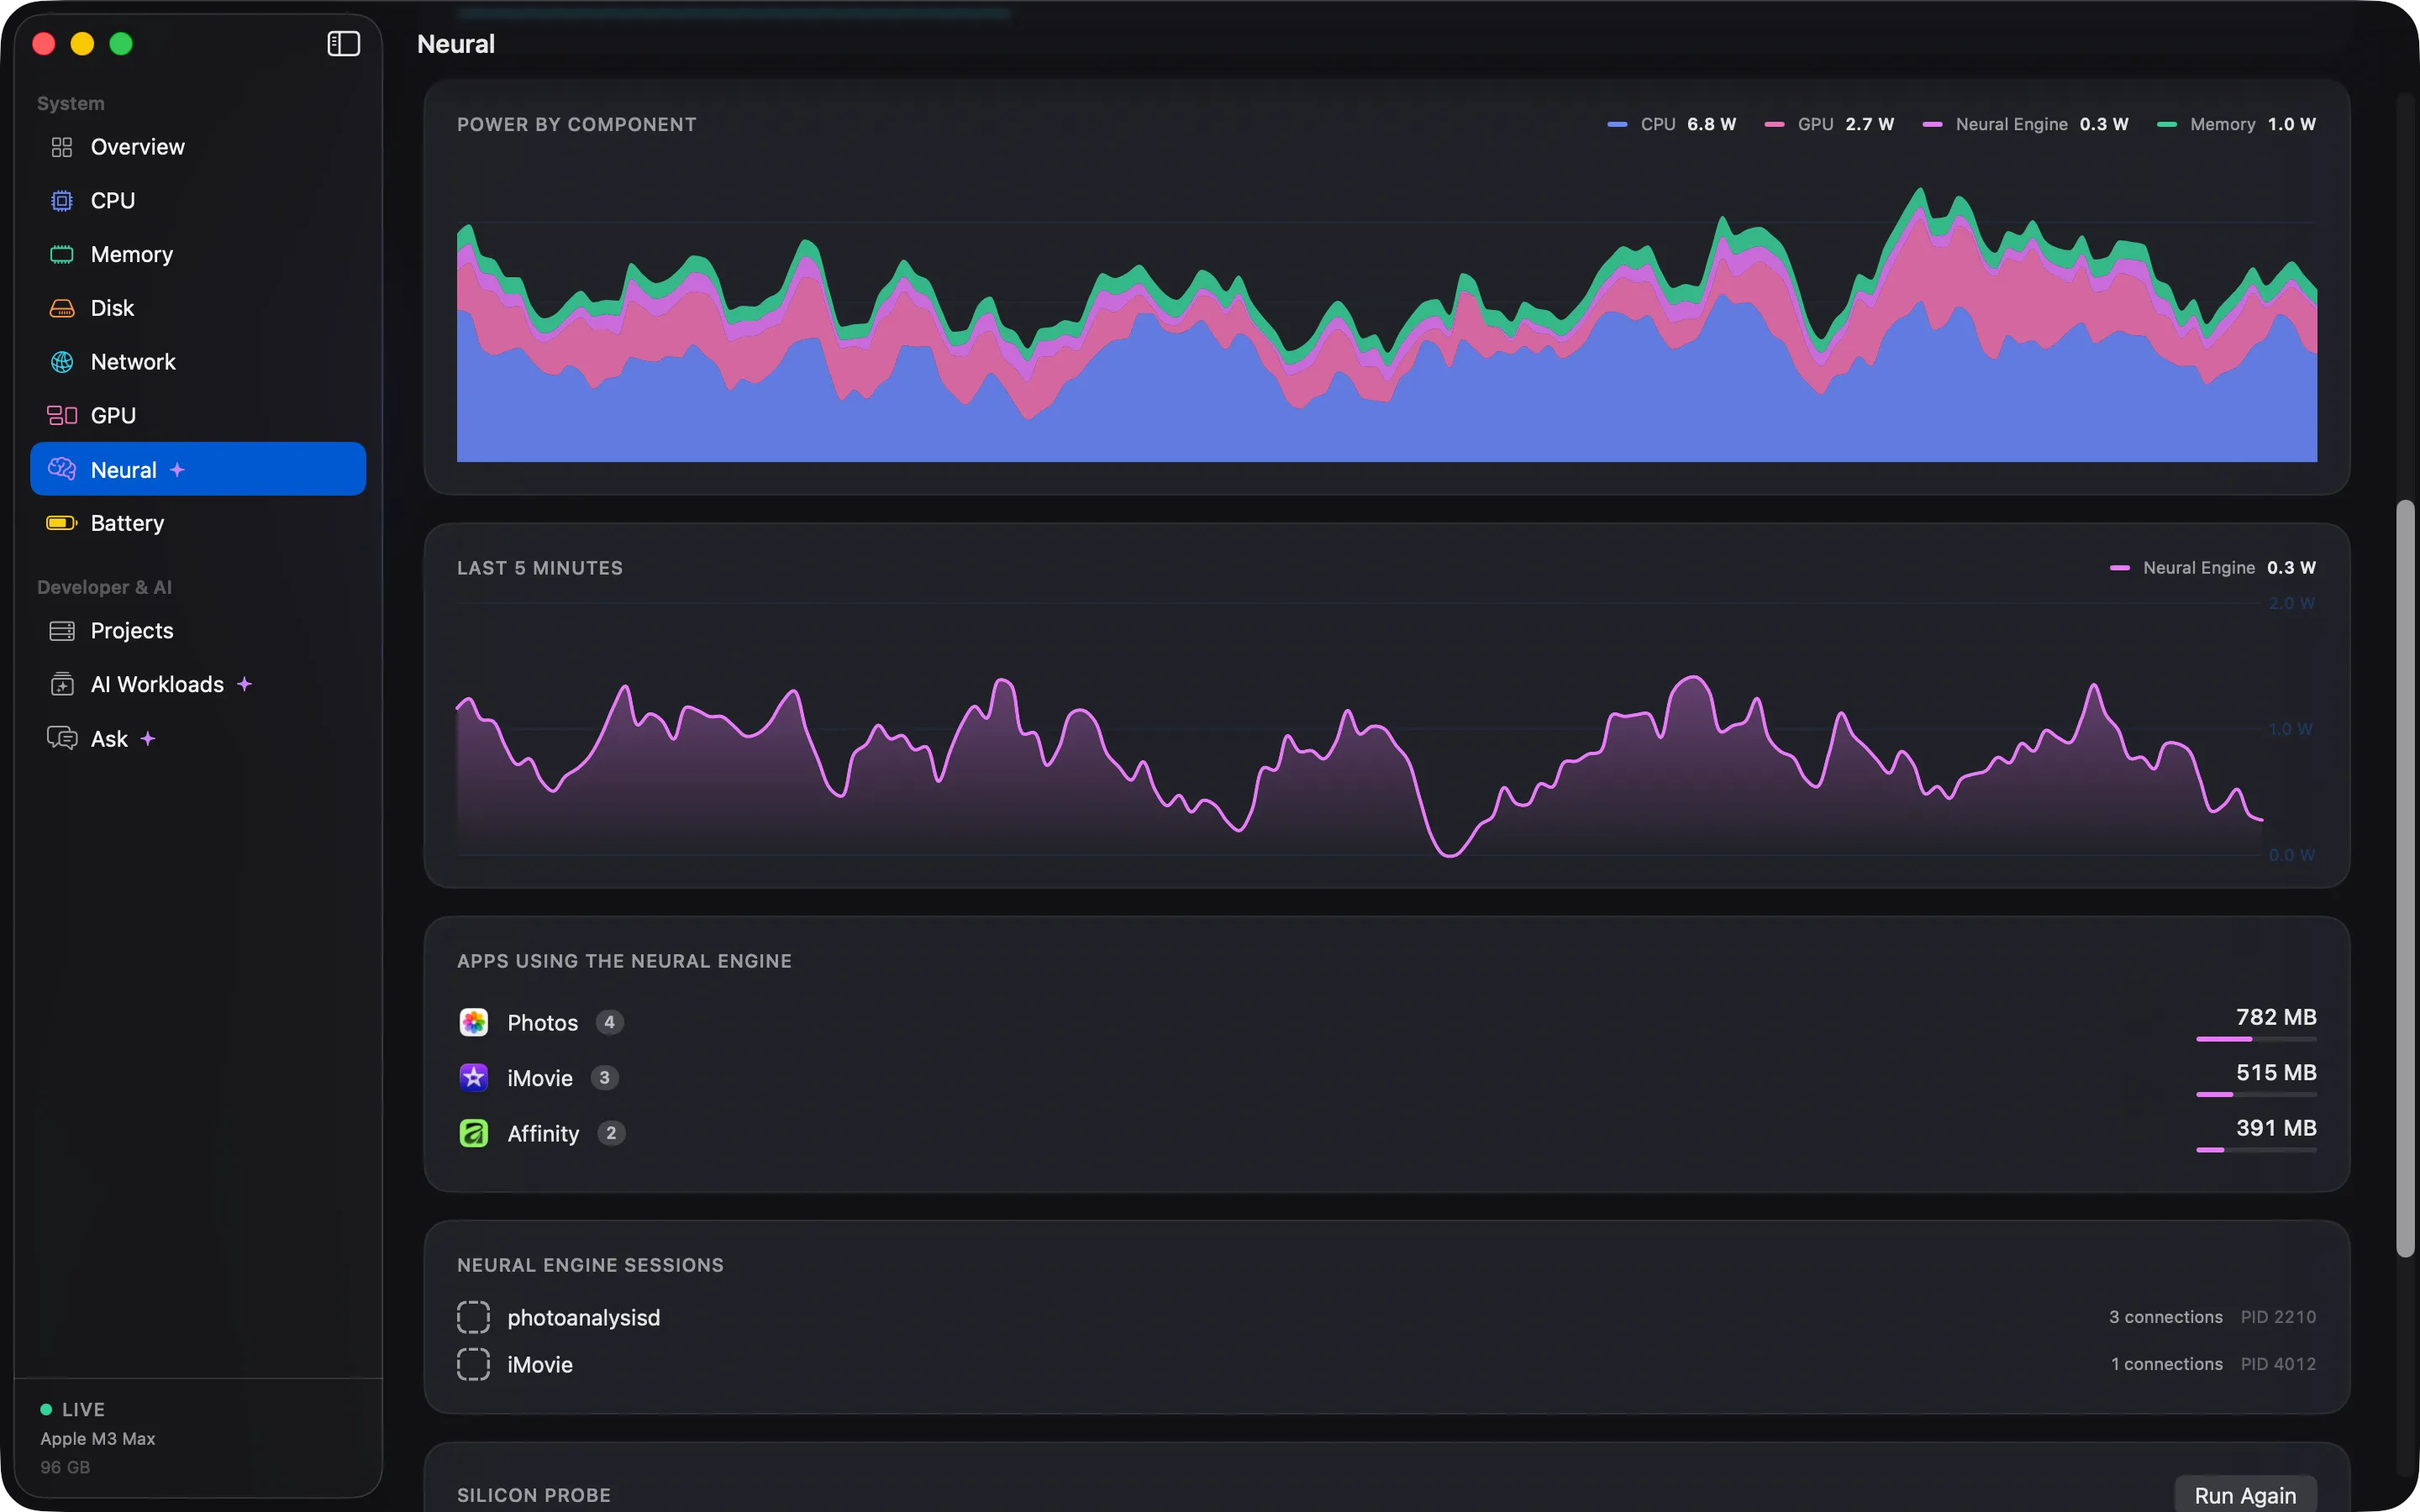
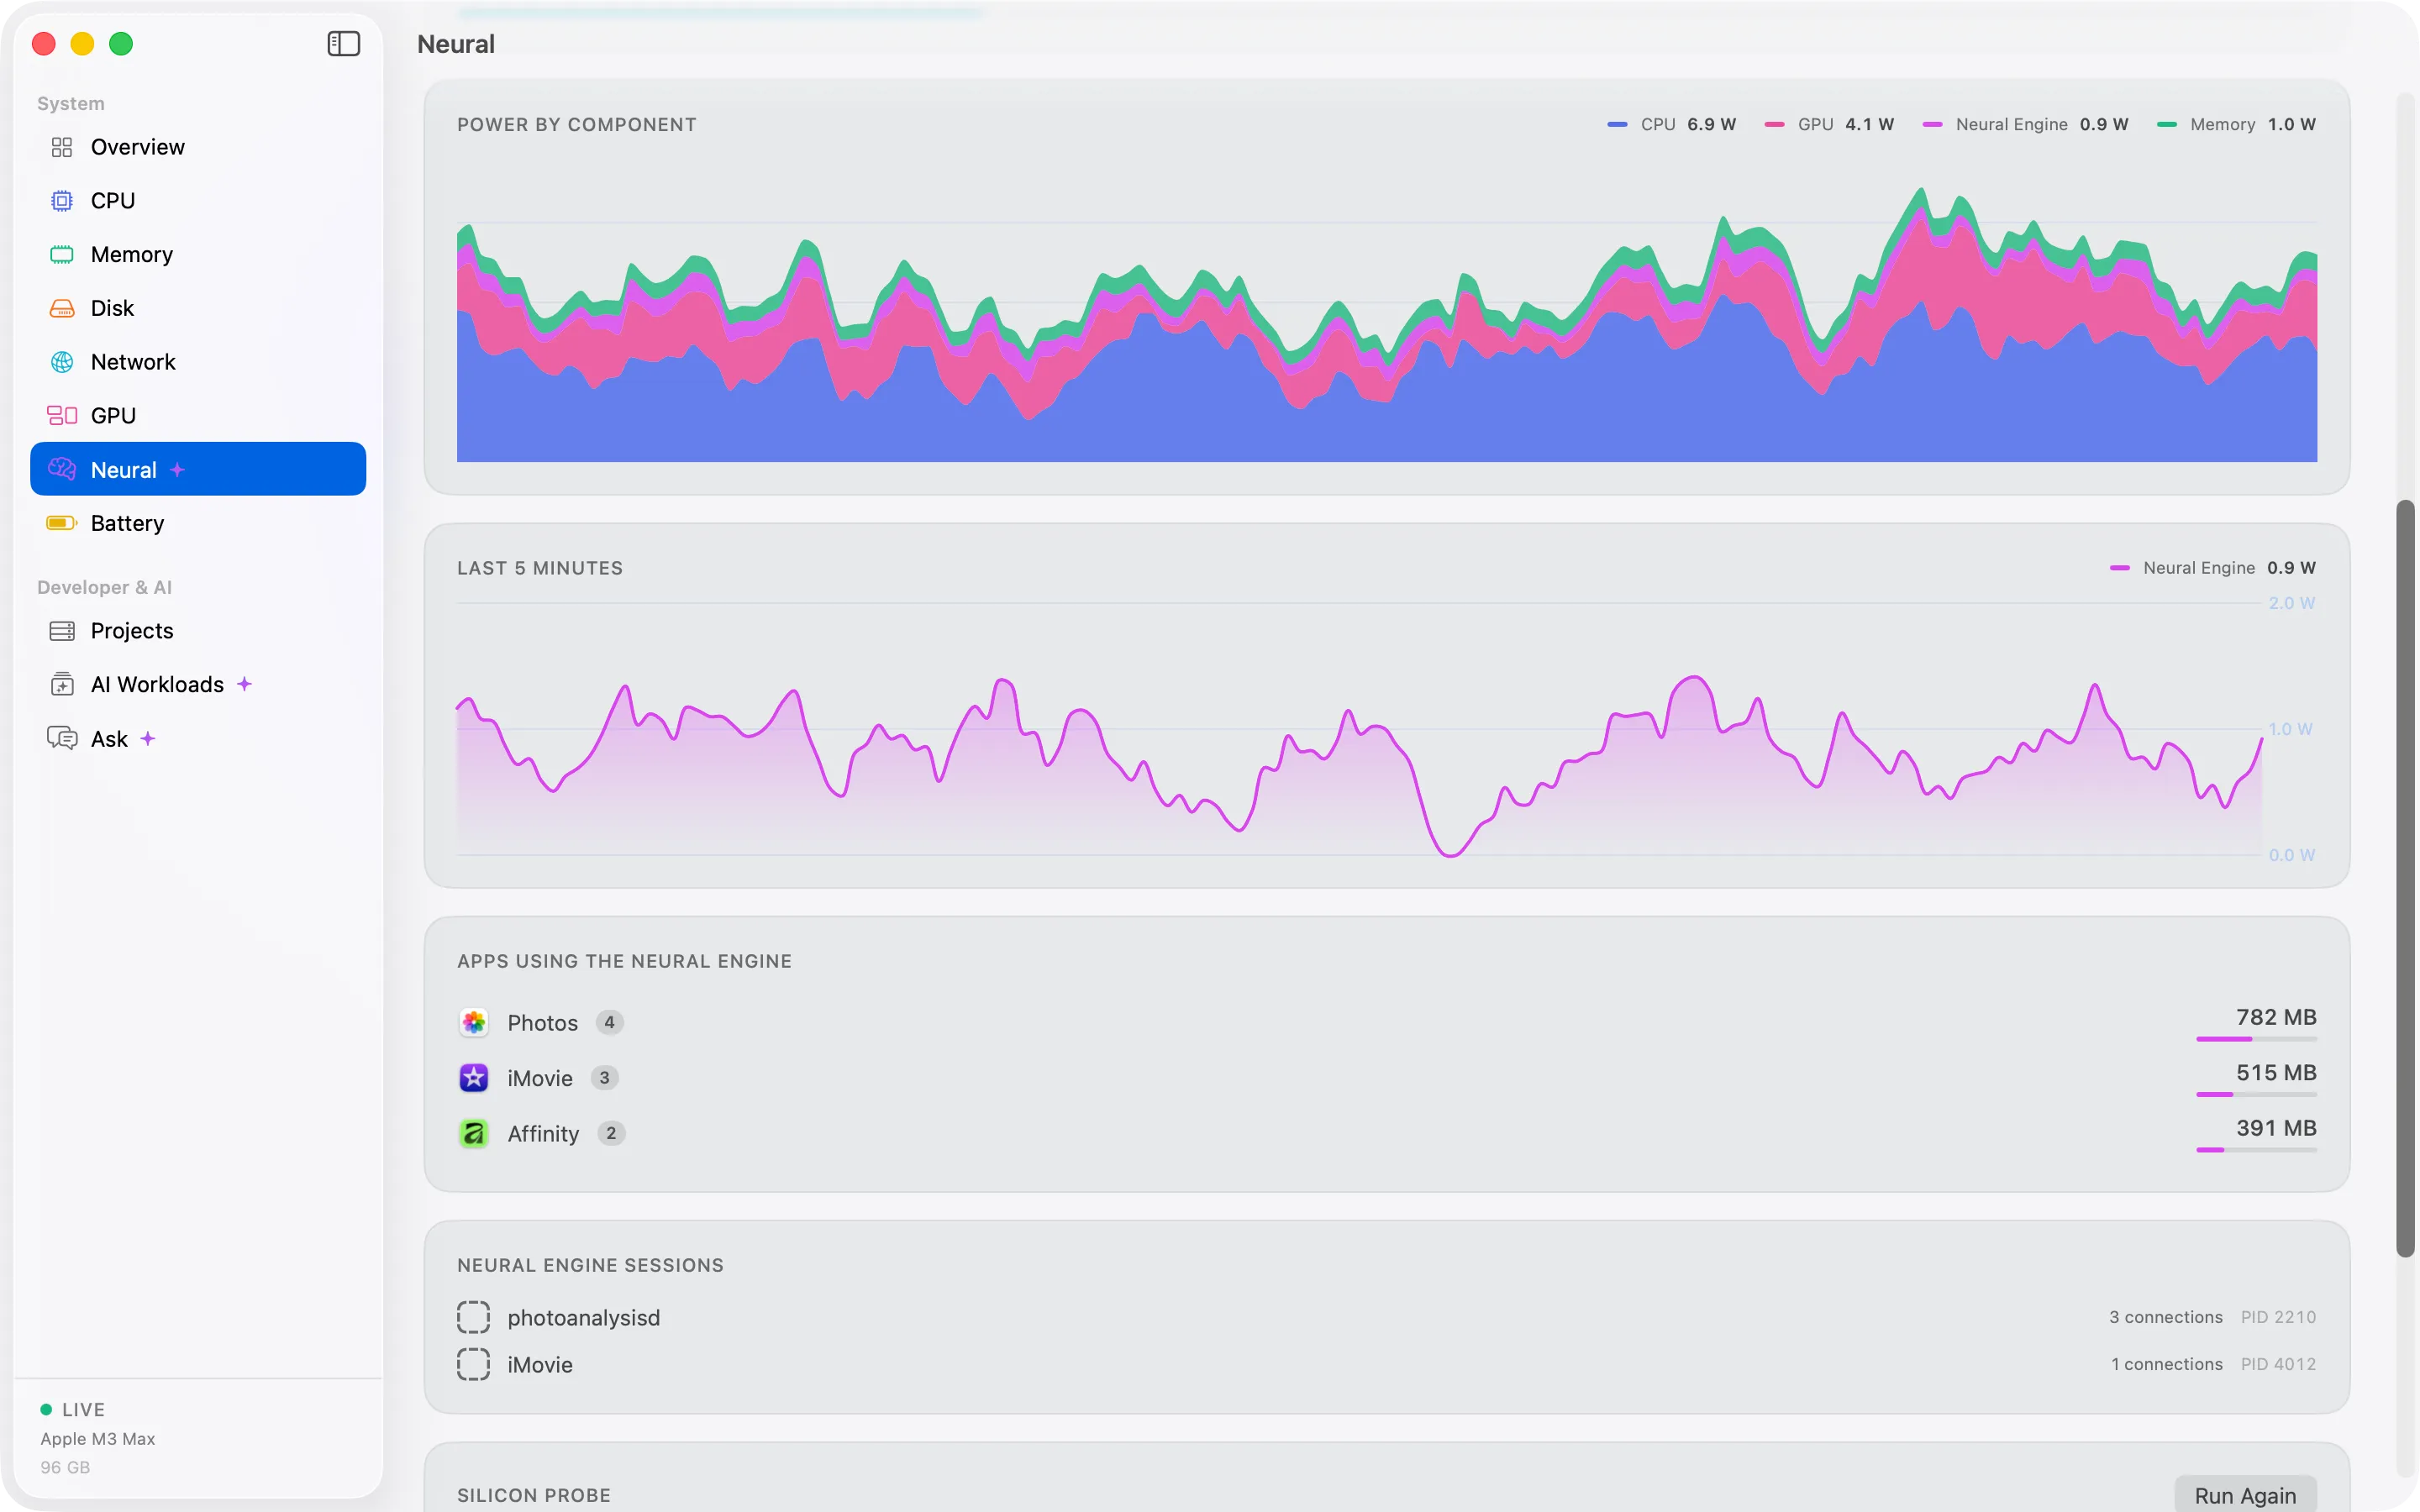
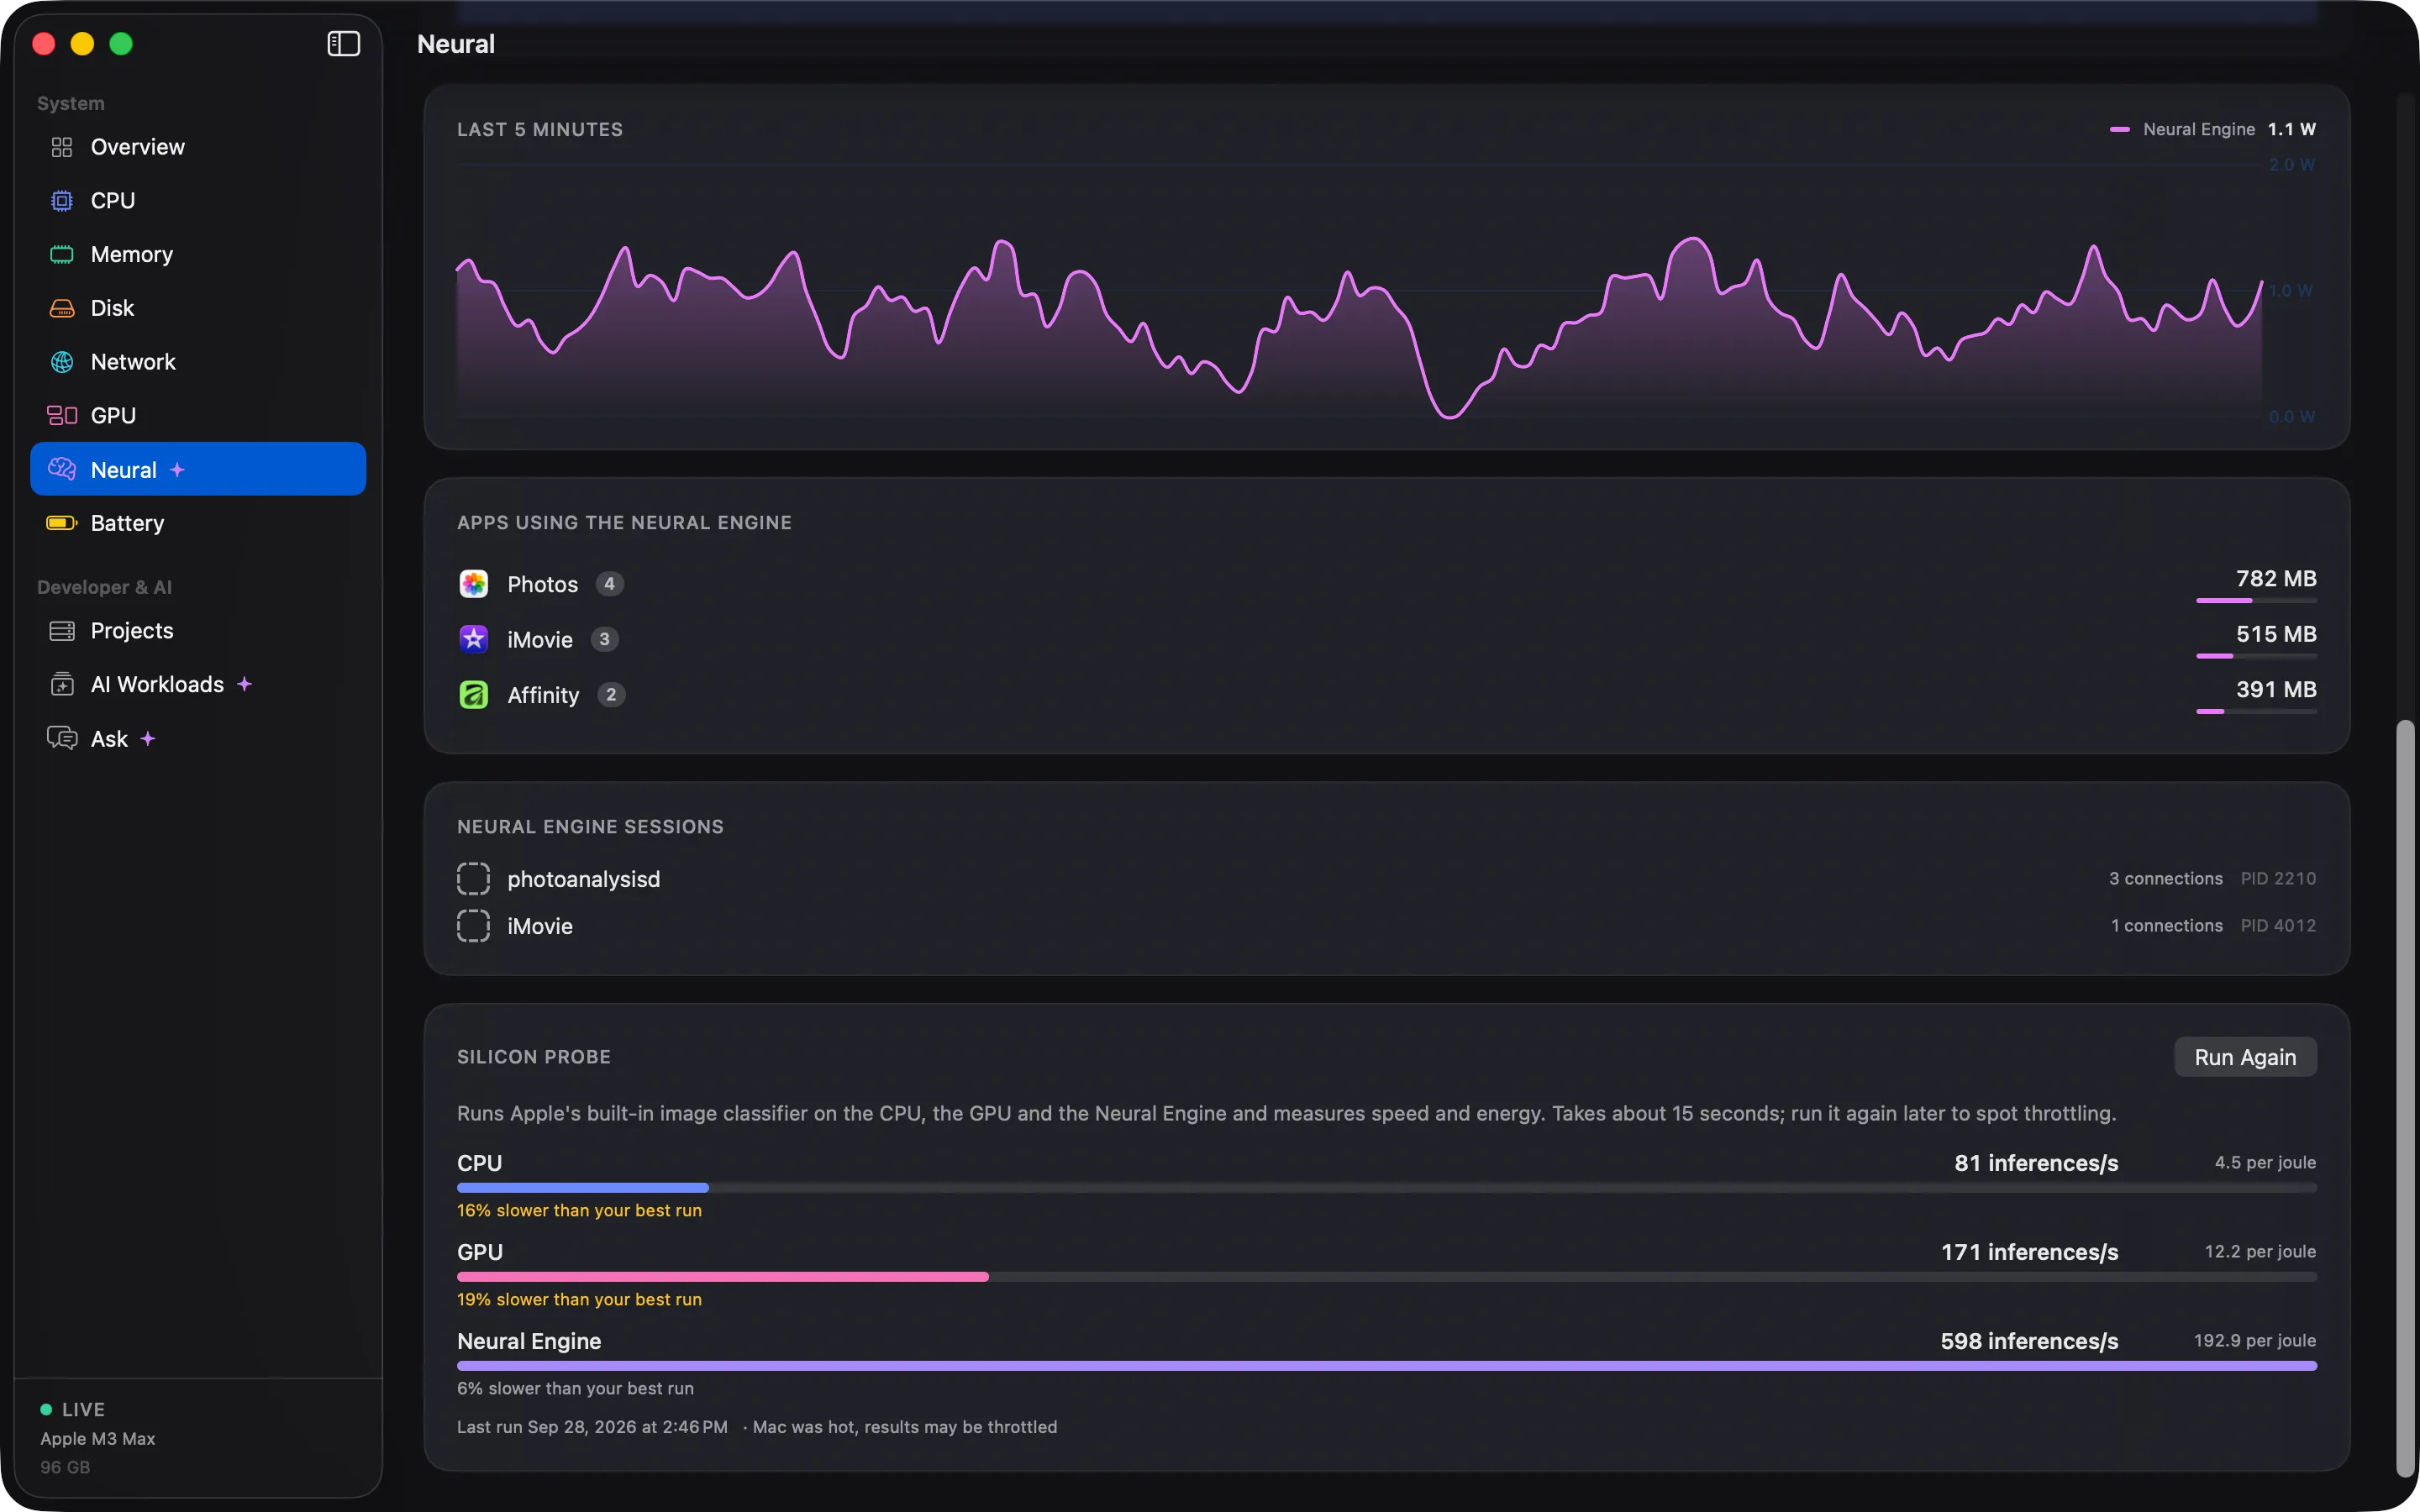
See Neural Engine power and estimated load next to CPU, GPU and DRAM, and which apps hold Neural Engine memory.

The Neural Engine does more of your Mac’s work every year, yet most monitors do not show it at all. Cortex reports its power draw, an estimate of its load, and the apps that are using it.

Load is an estimate. macOS does not expose an exact figure, and Cortex says so.

  • Neural Engine power and estimated load
  • Stacked CPU, GPU, ANE and DRAM power chart
  • Which apps hold Neural Engine memory
  • The list of Neural Engine clients
The Cortex Neural Engine screen with a stacked power chart for CPU, GPU, Neural Engine and DRAM.The Cortex Neural Engine screen with a stacked power chart for CPU, GPU, Neural Engine and DRAM.

Local AI

Local AI workloads

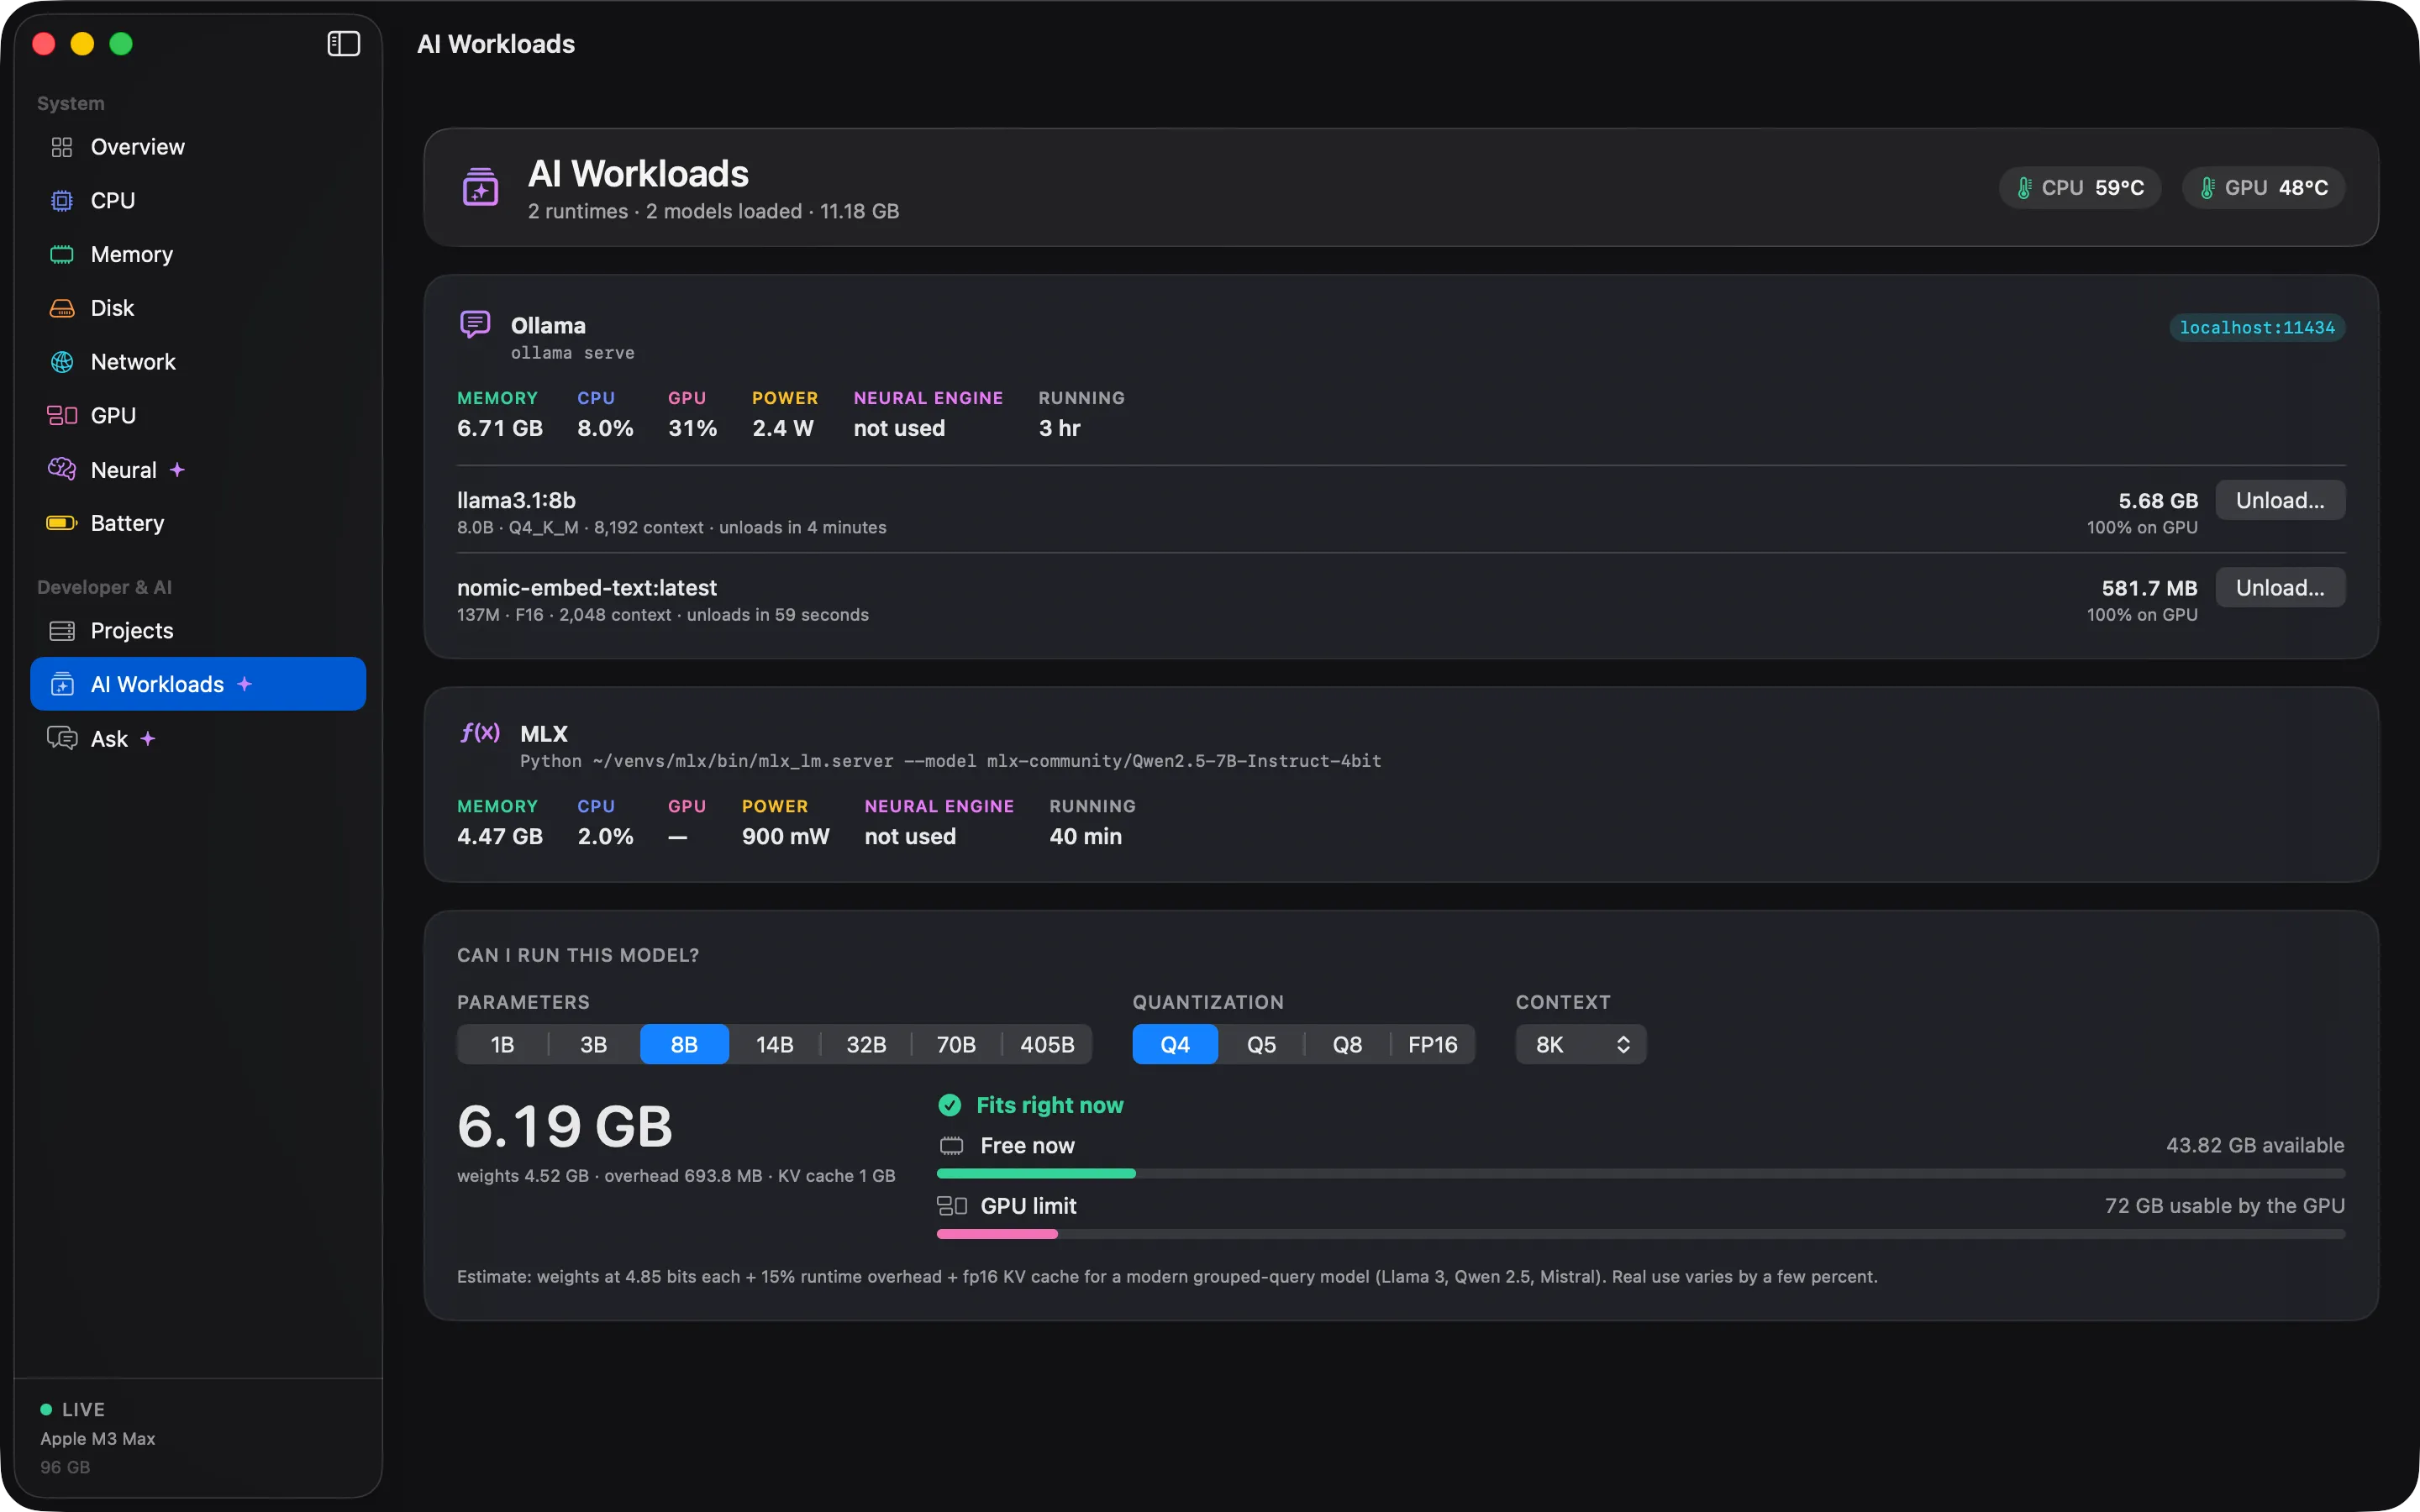
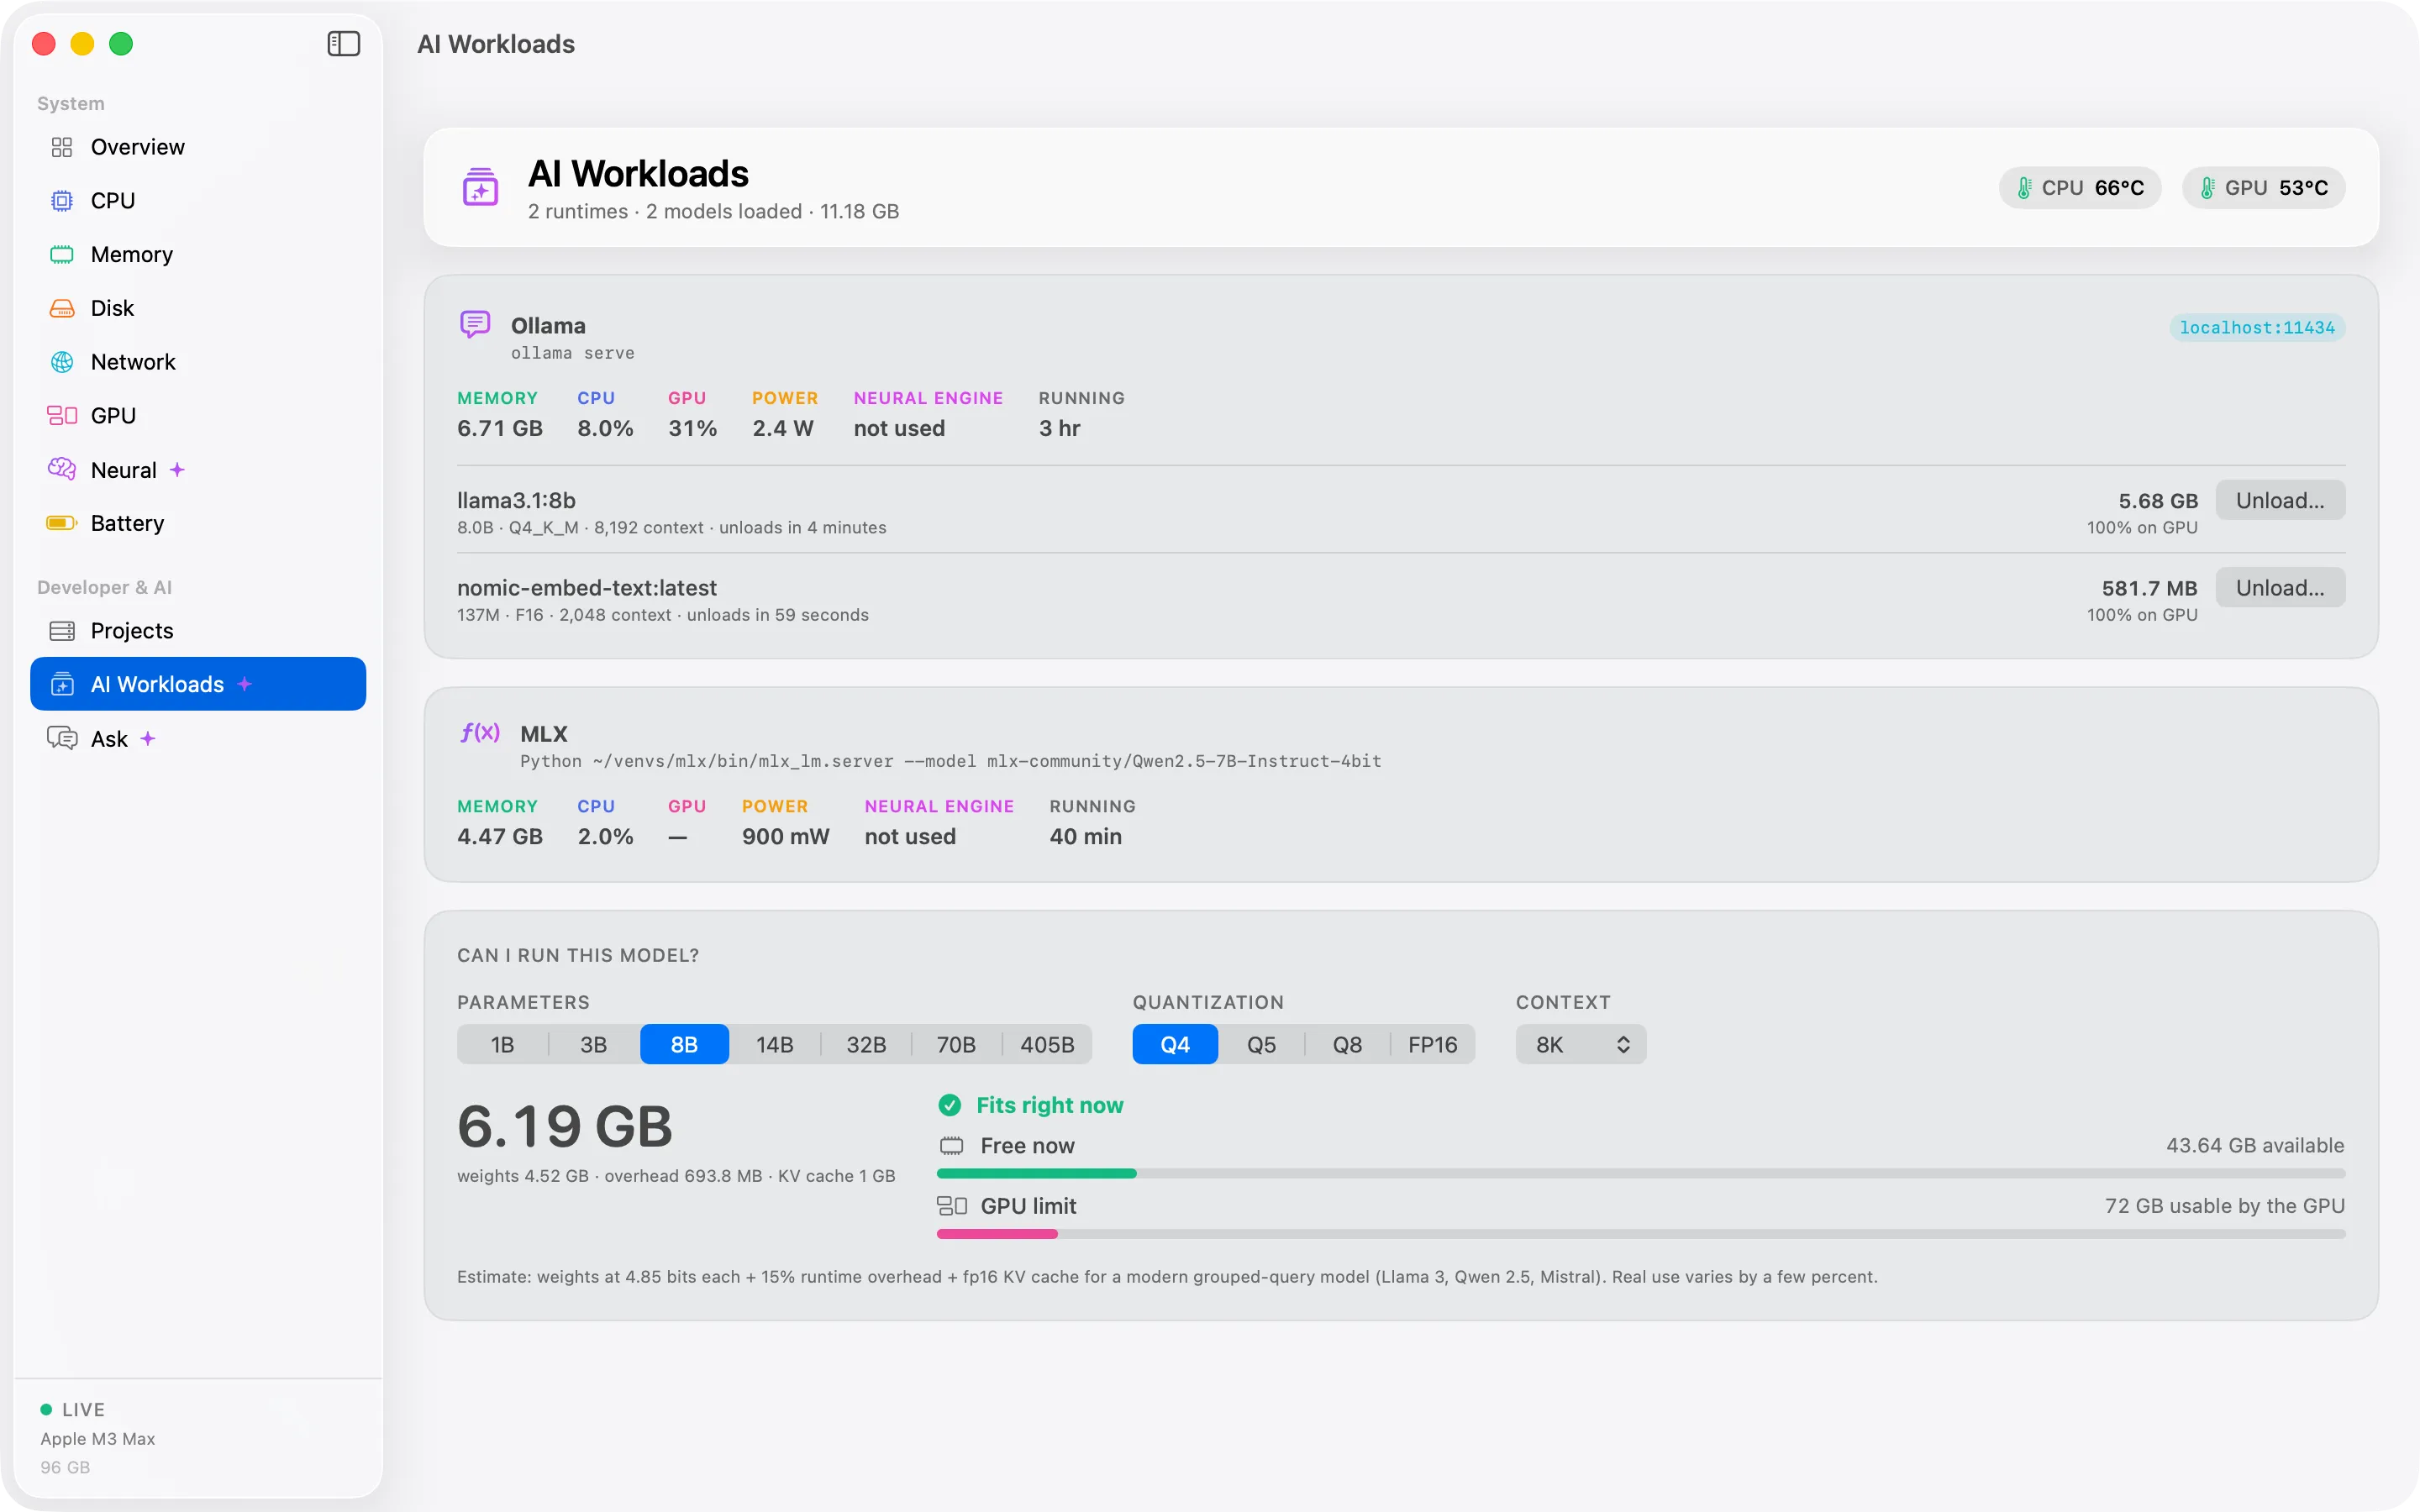
Cortex detects Ollama, LM Studio, llama.cpp server, ComfyUI and MLX or PyTorch processes, and shows the models they have loaded.

A model you loaded an hour ago can still be holding 40 GB of unified memory. Cortex finds local AI runtimes, lists what each one has loaded, and shows what it costs you in memory and power.

  • Loaded models, with their memory and power
  • Unload a model in Ollama, with confirmation
  • Talks to localhost only
The Cortex Local AI screen listing Ollama with two loaded models, their memory and power use.The Cortex Local AI screen listing Ollama with two loaded models, their memory and power use.

Can I run this model?

Model Fit Advisor

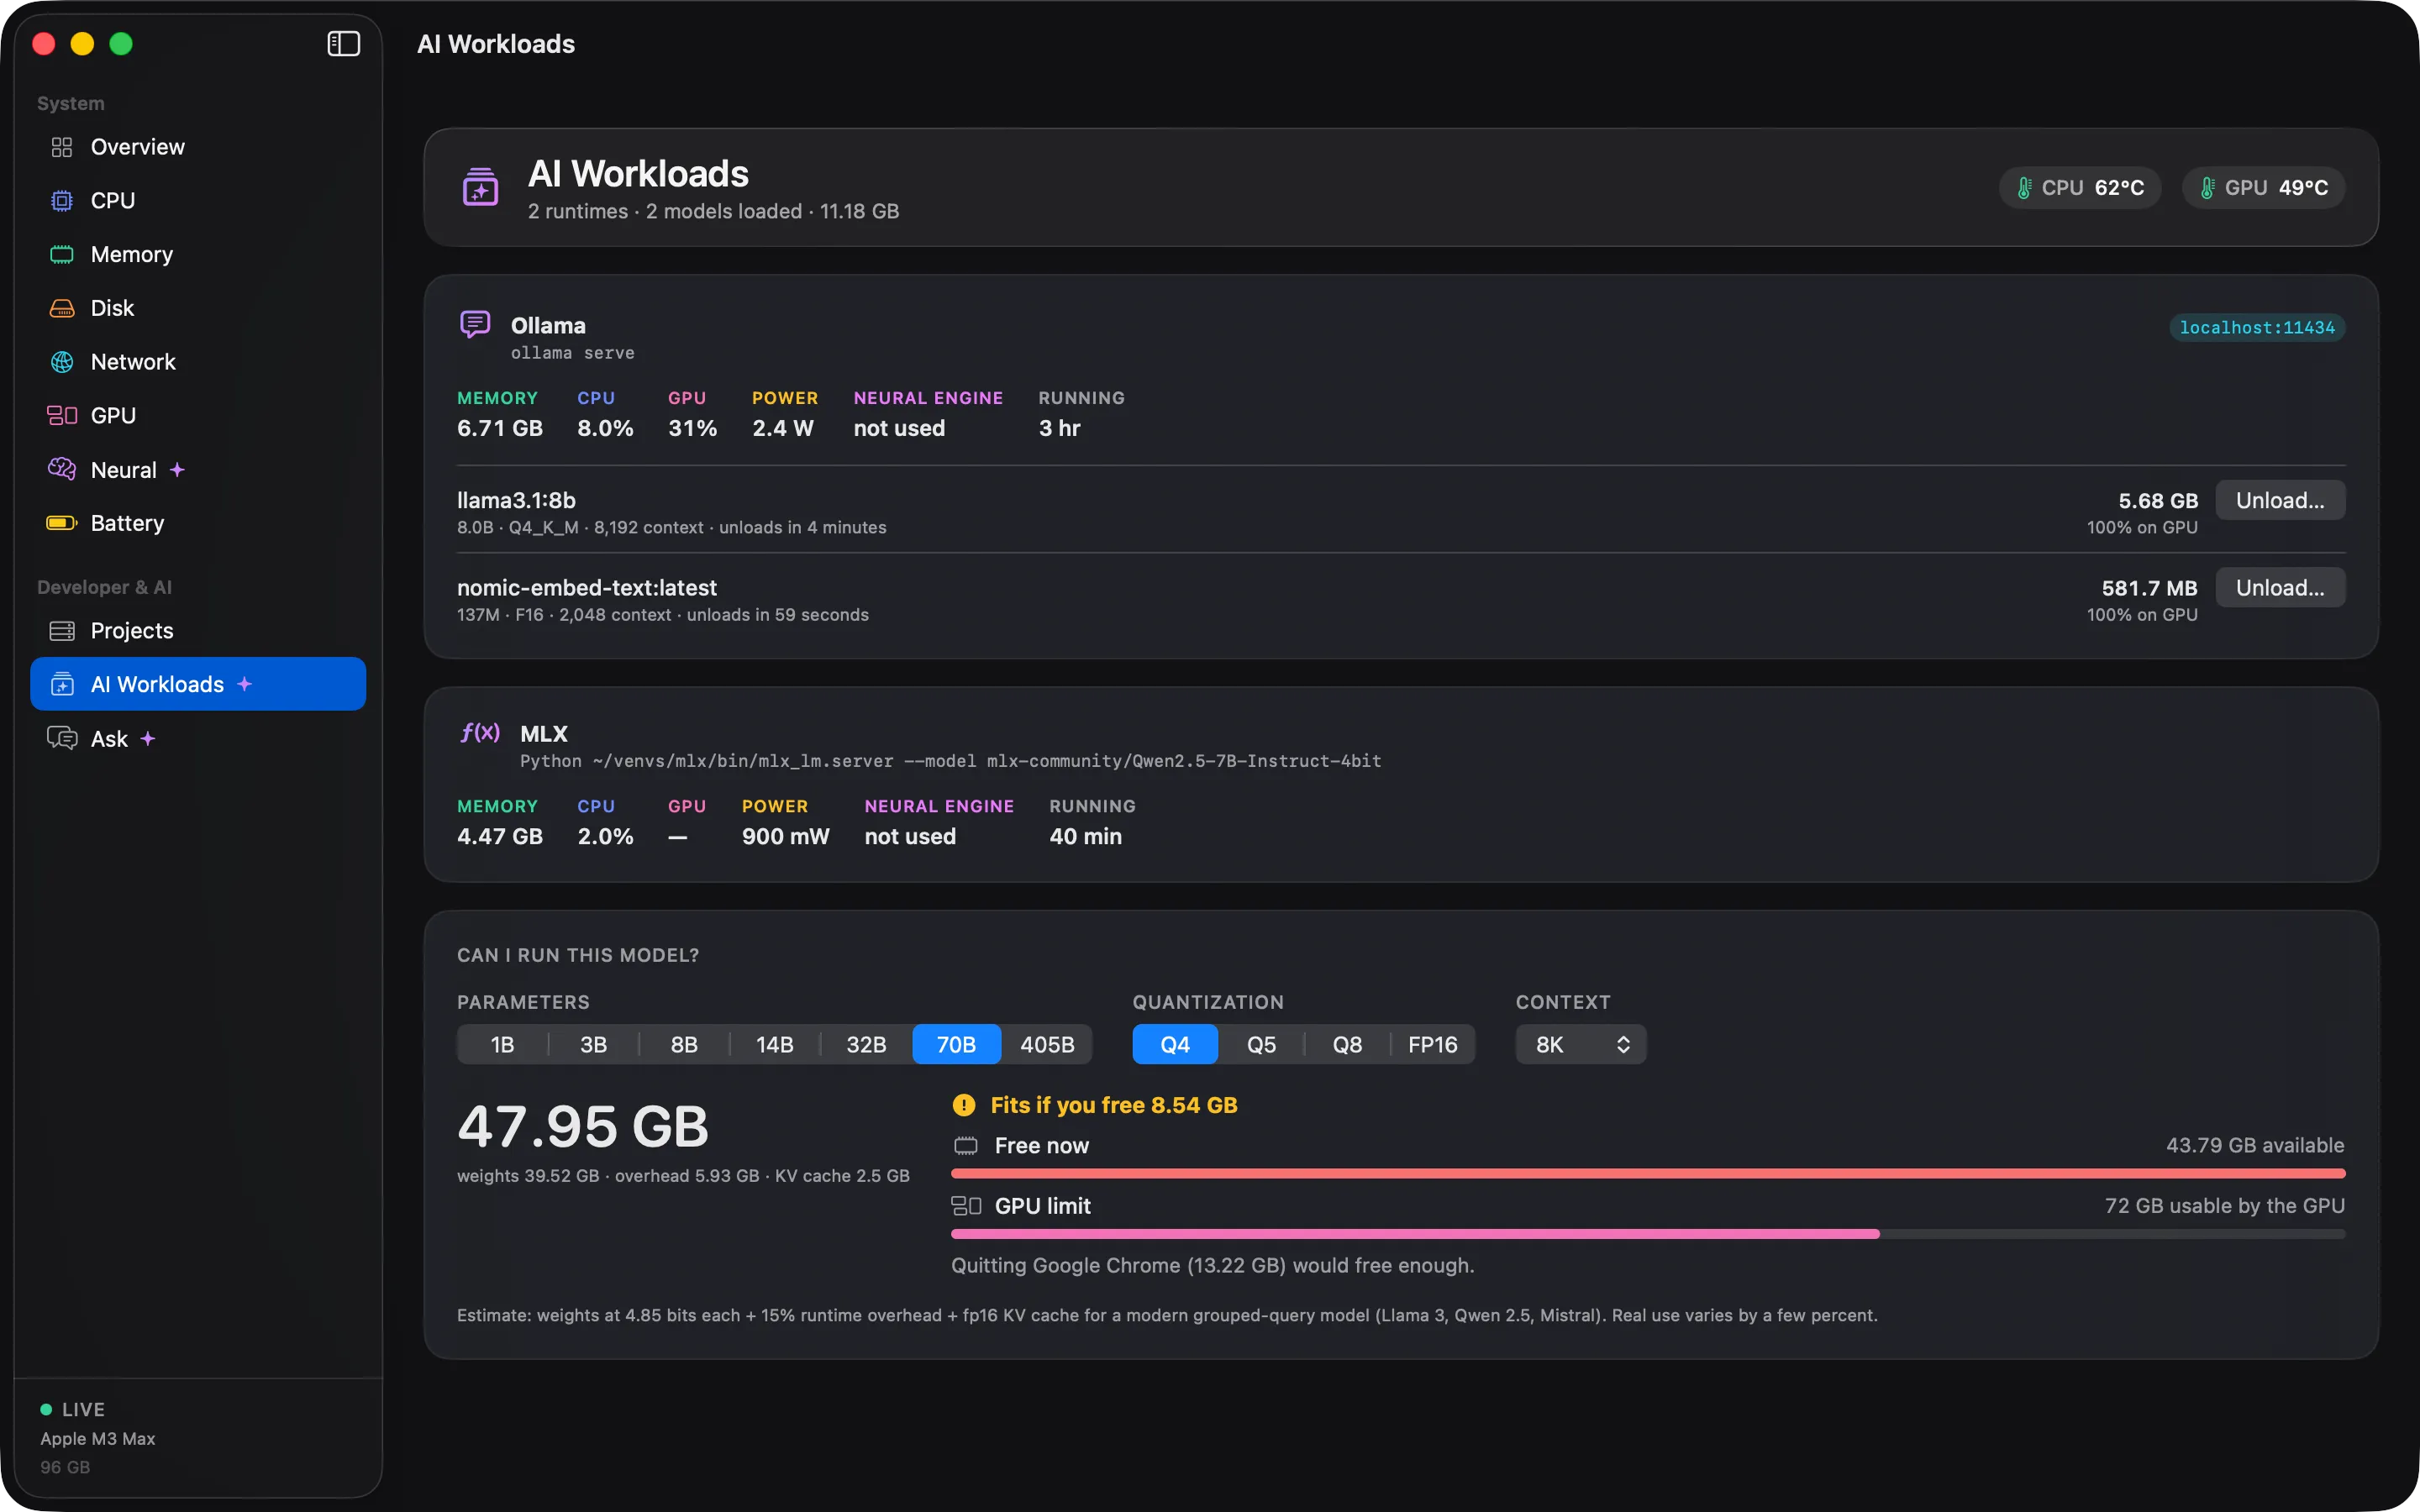
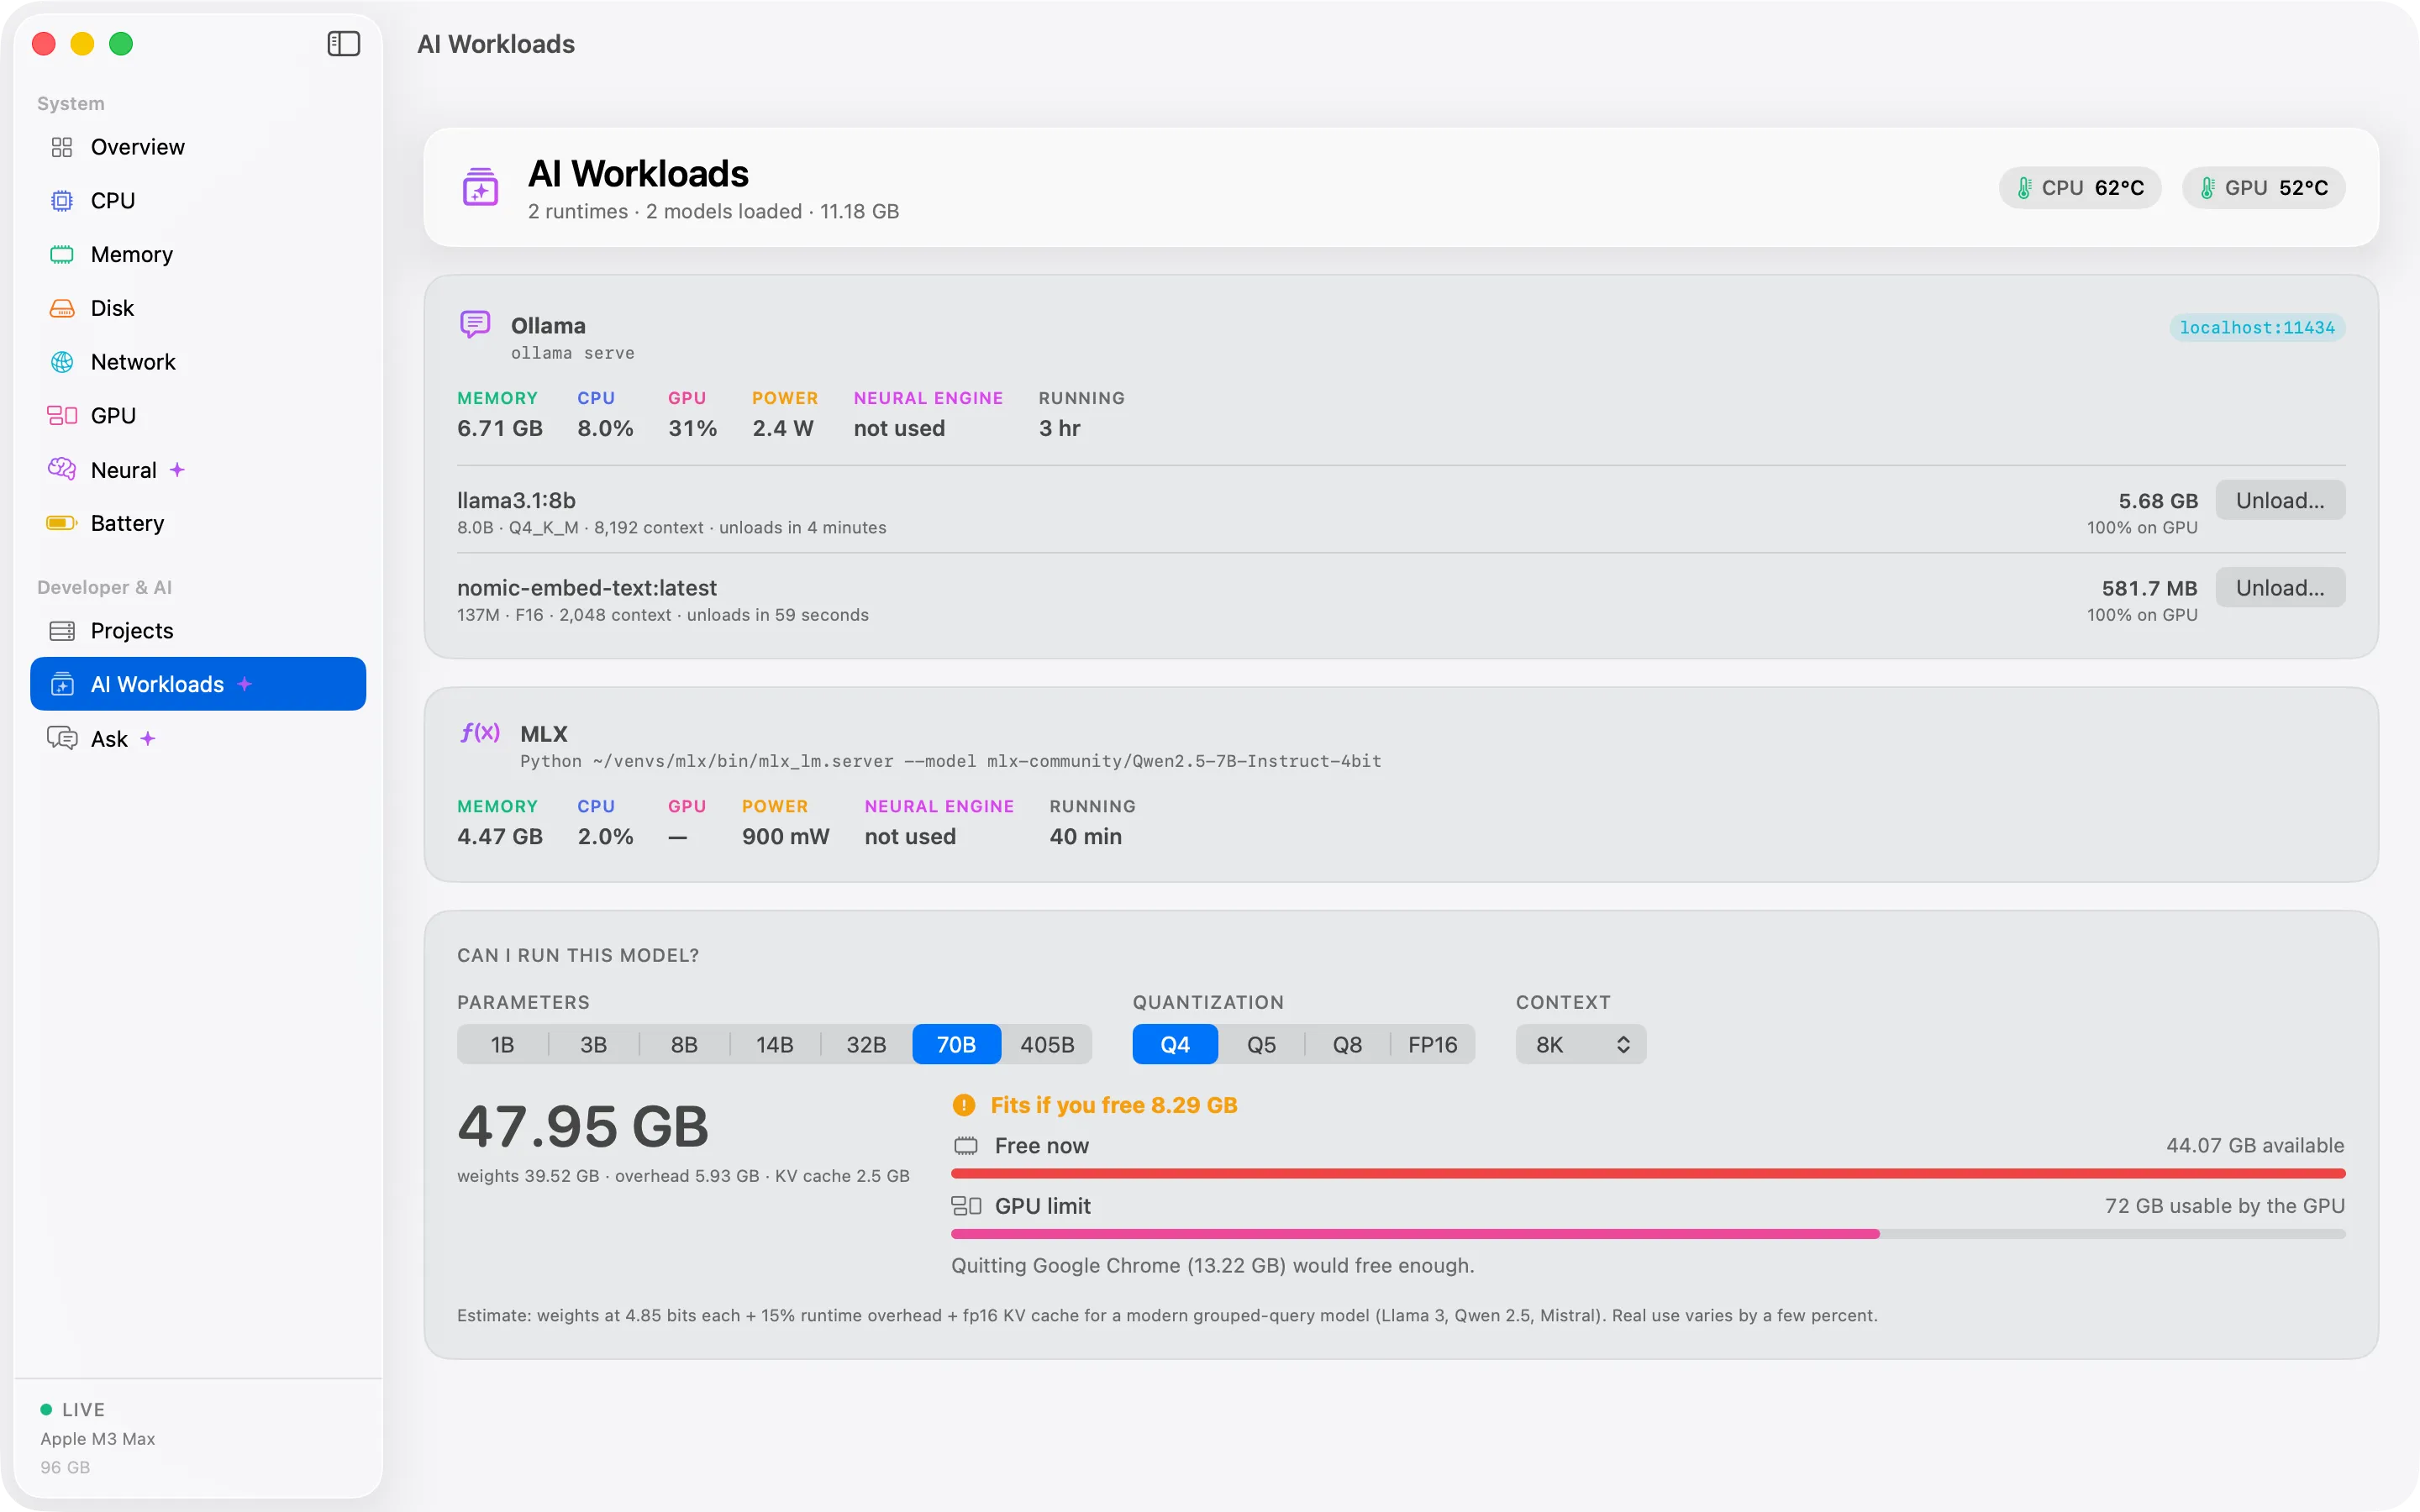
Pick the parameters, quantization and context length. Cortex compares the model with your free unified memory and the GPU memory limit.

Before you download 40 GB of weights, find out whether they fit. The advisor works from what your Mac has free right now, and when a model almost fits it tells you which app to close.

  • Sizes such as 8B, 32B and 70B
  • Quantization and context length
  • Checks free unified memory and the GPU memory limit
  • Tells you what to close, for example "close Chrome to free 21 GB"
The Model Fit Advisor comparing a 70B model at 4-bit quantization with the free memory on this Mac.The Model Fit Advisor comparing a 70B model at 4-bit quantization with the free memory on this Mac.

On-device assistant

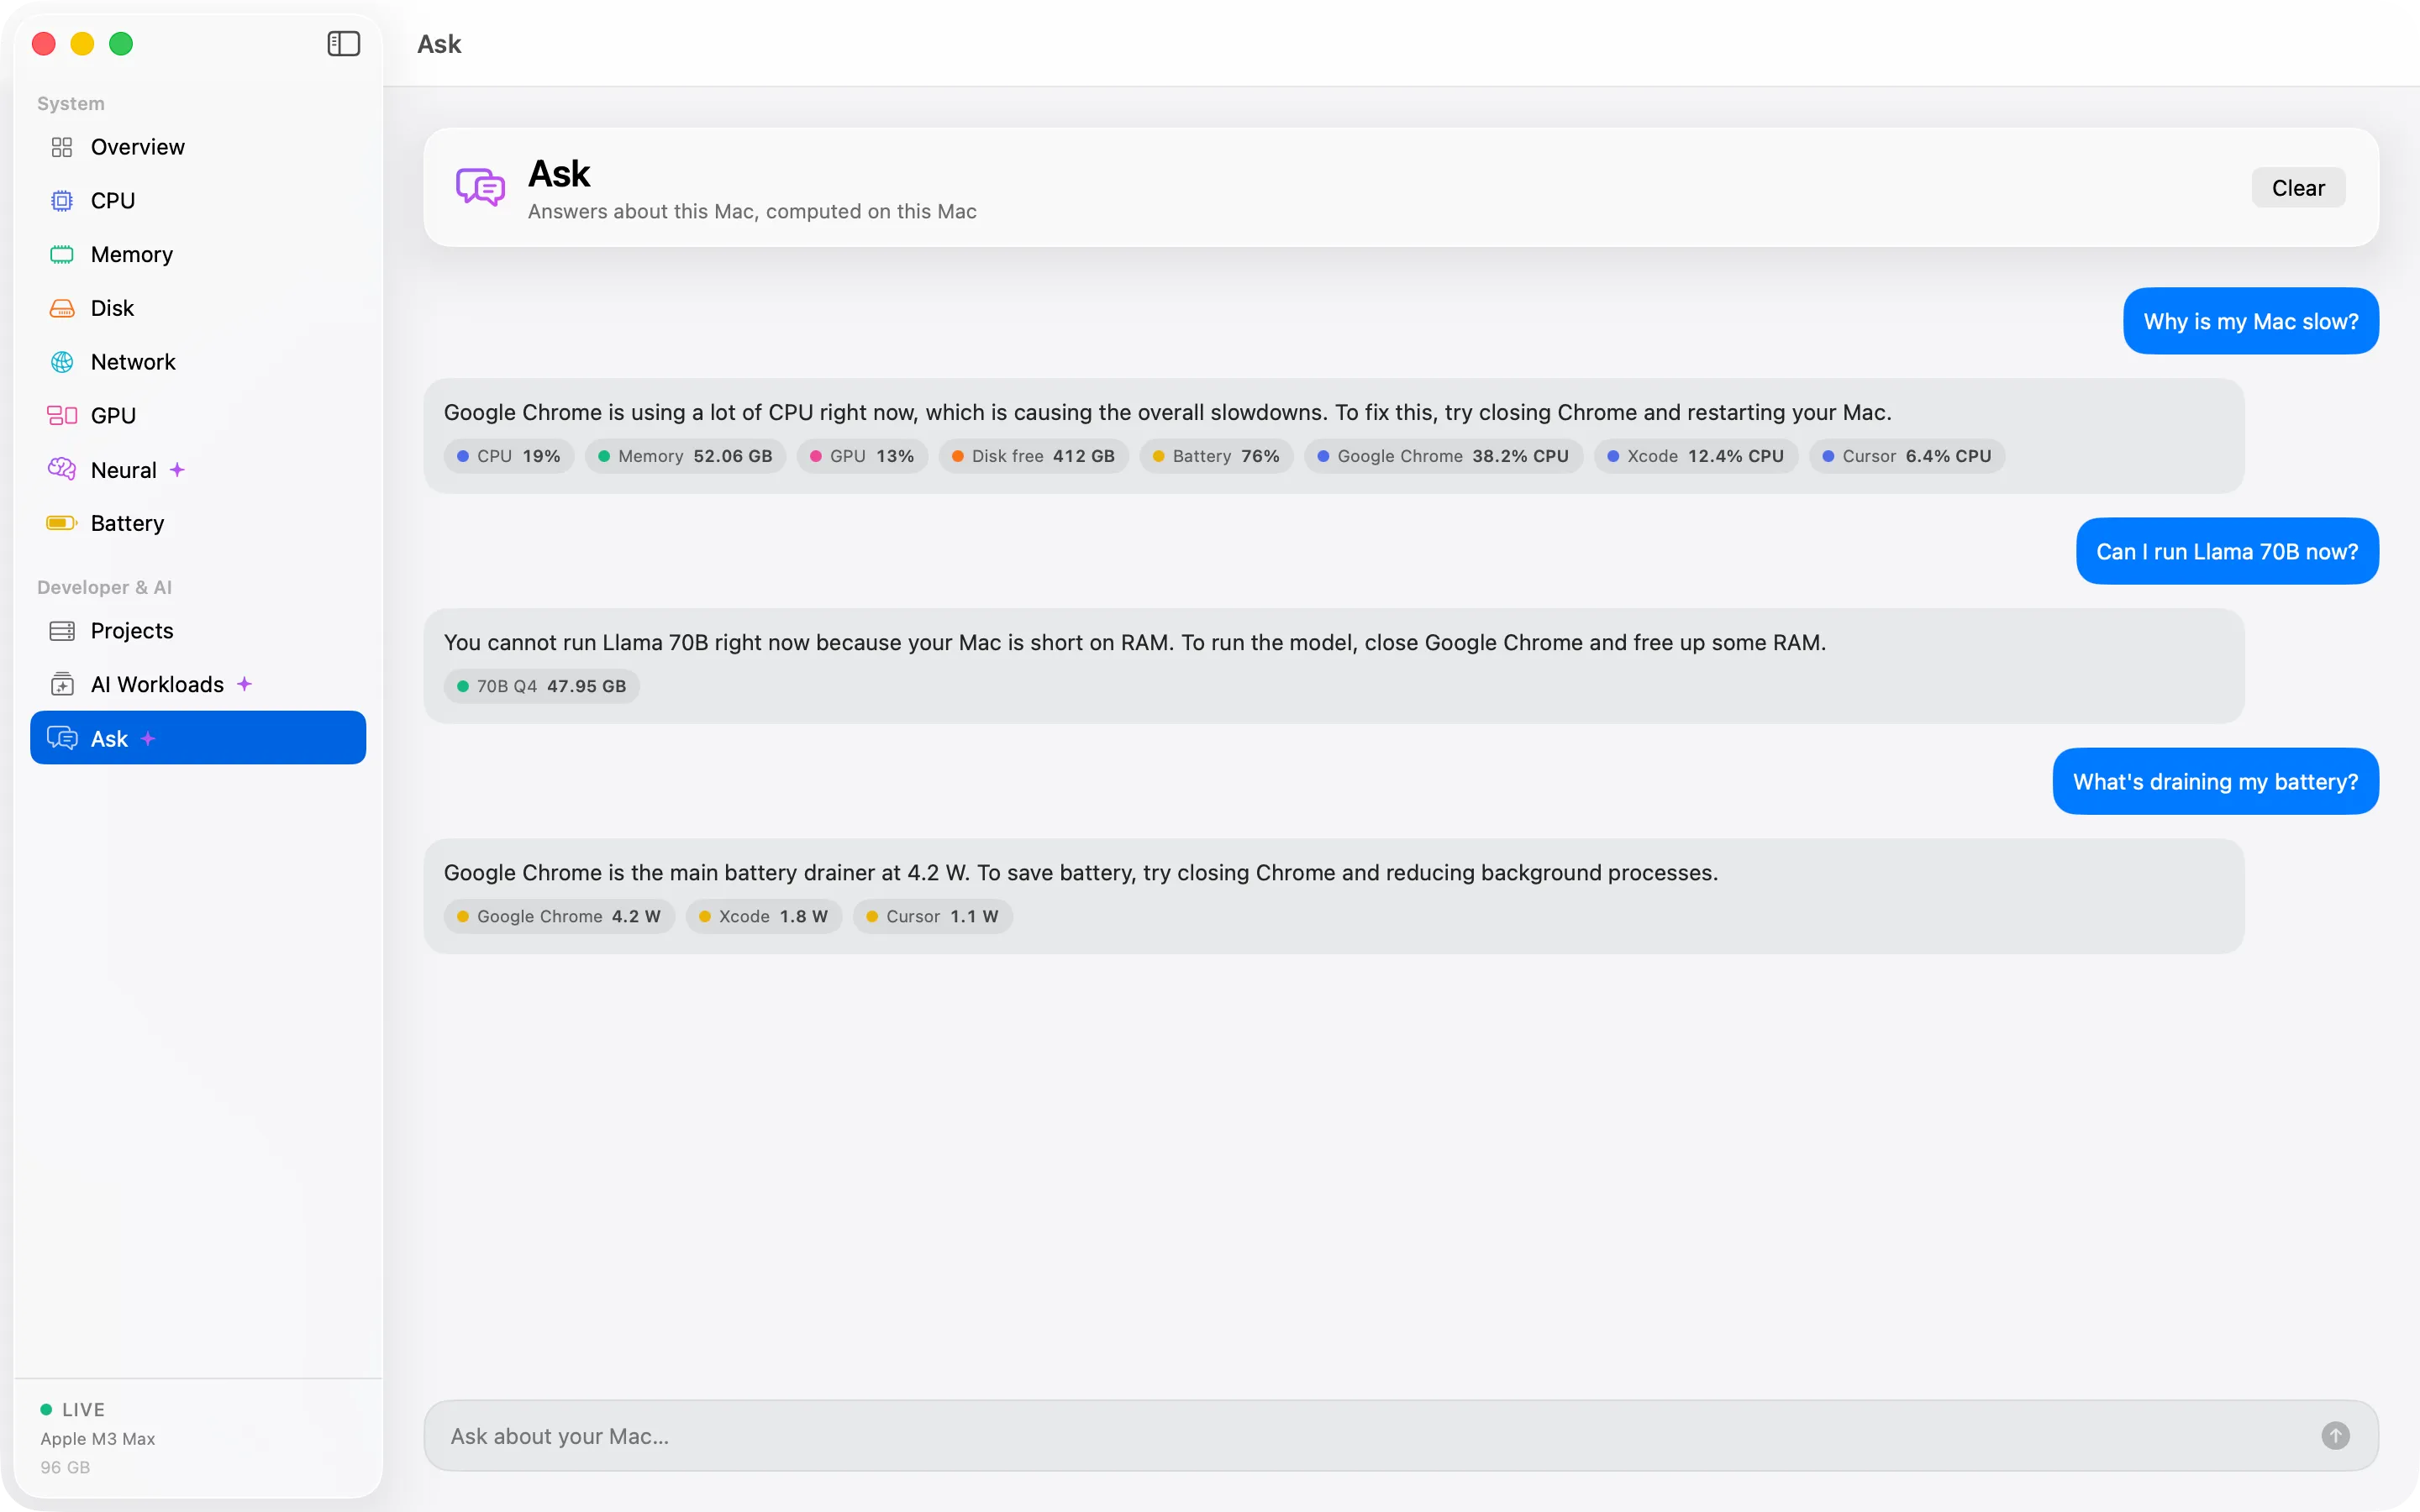
Ask Cortex

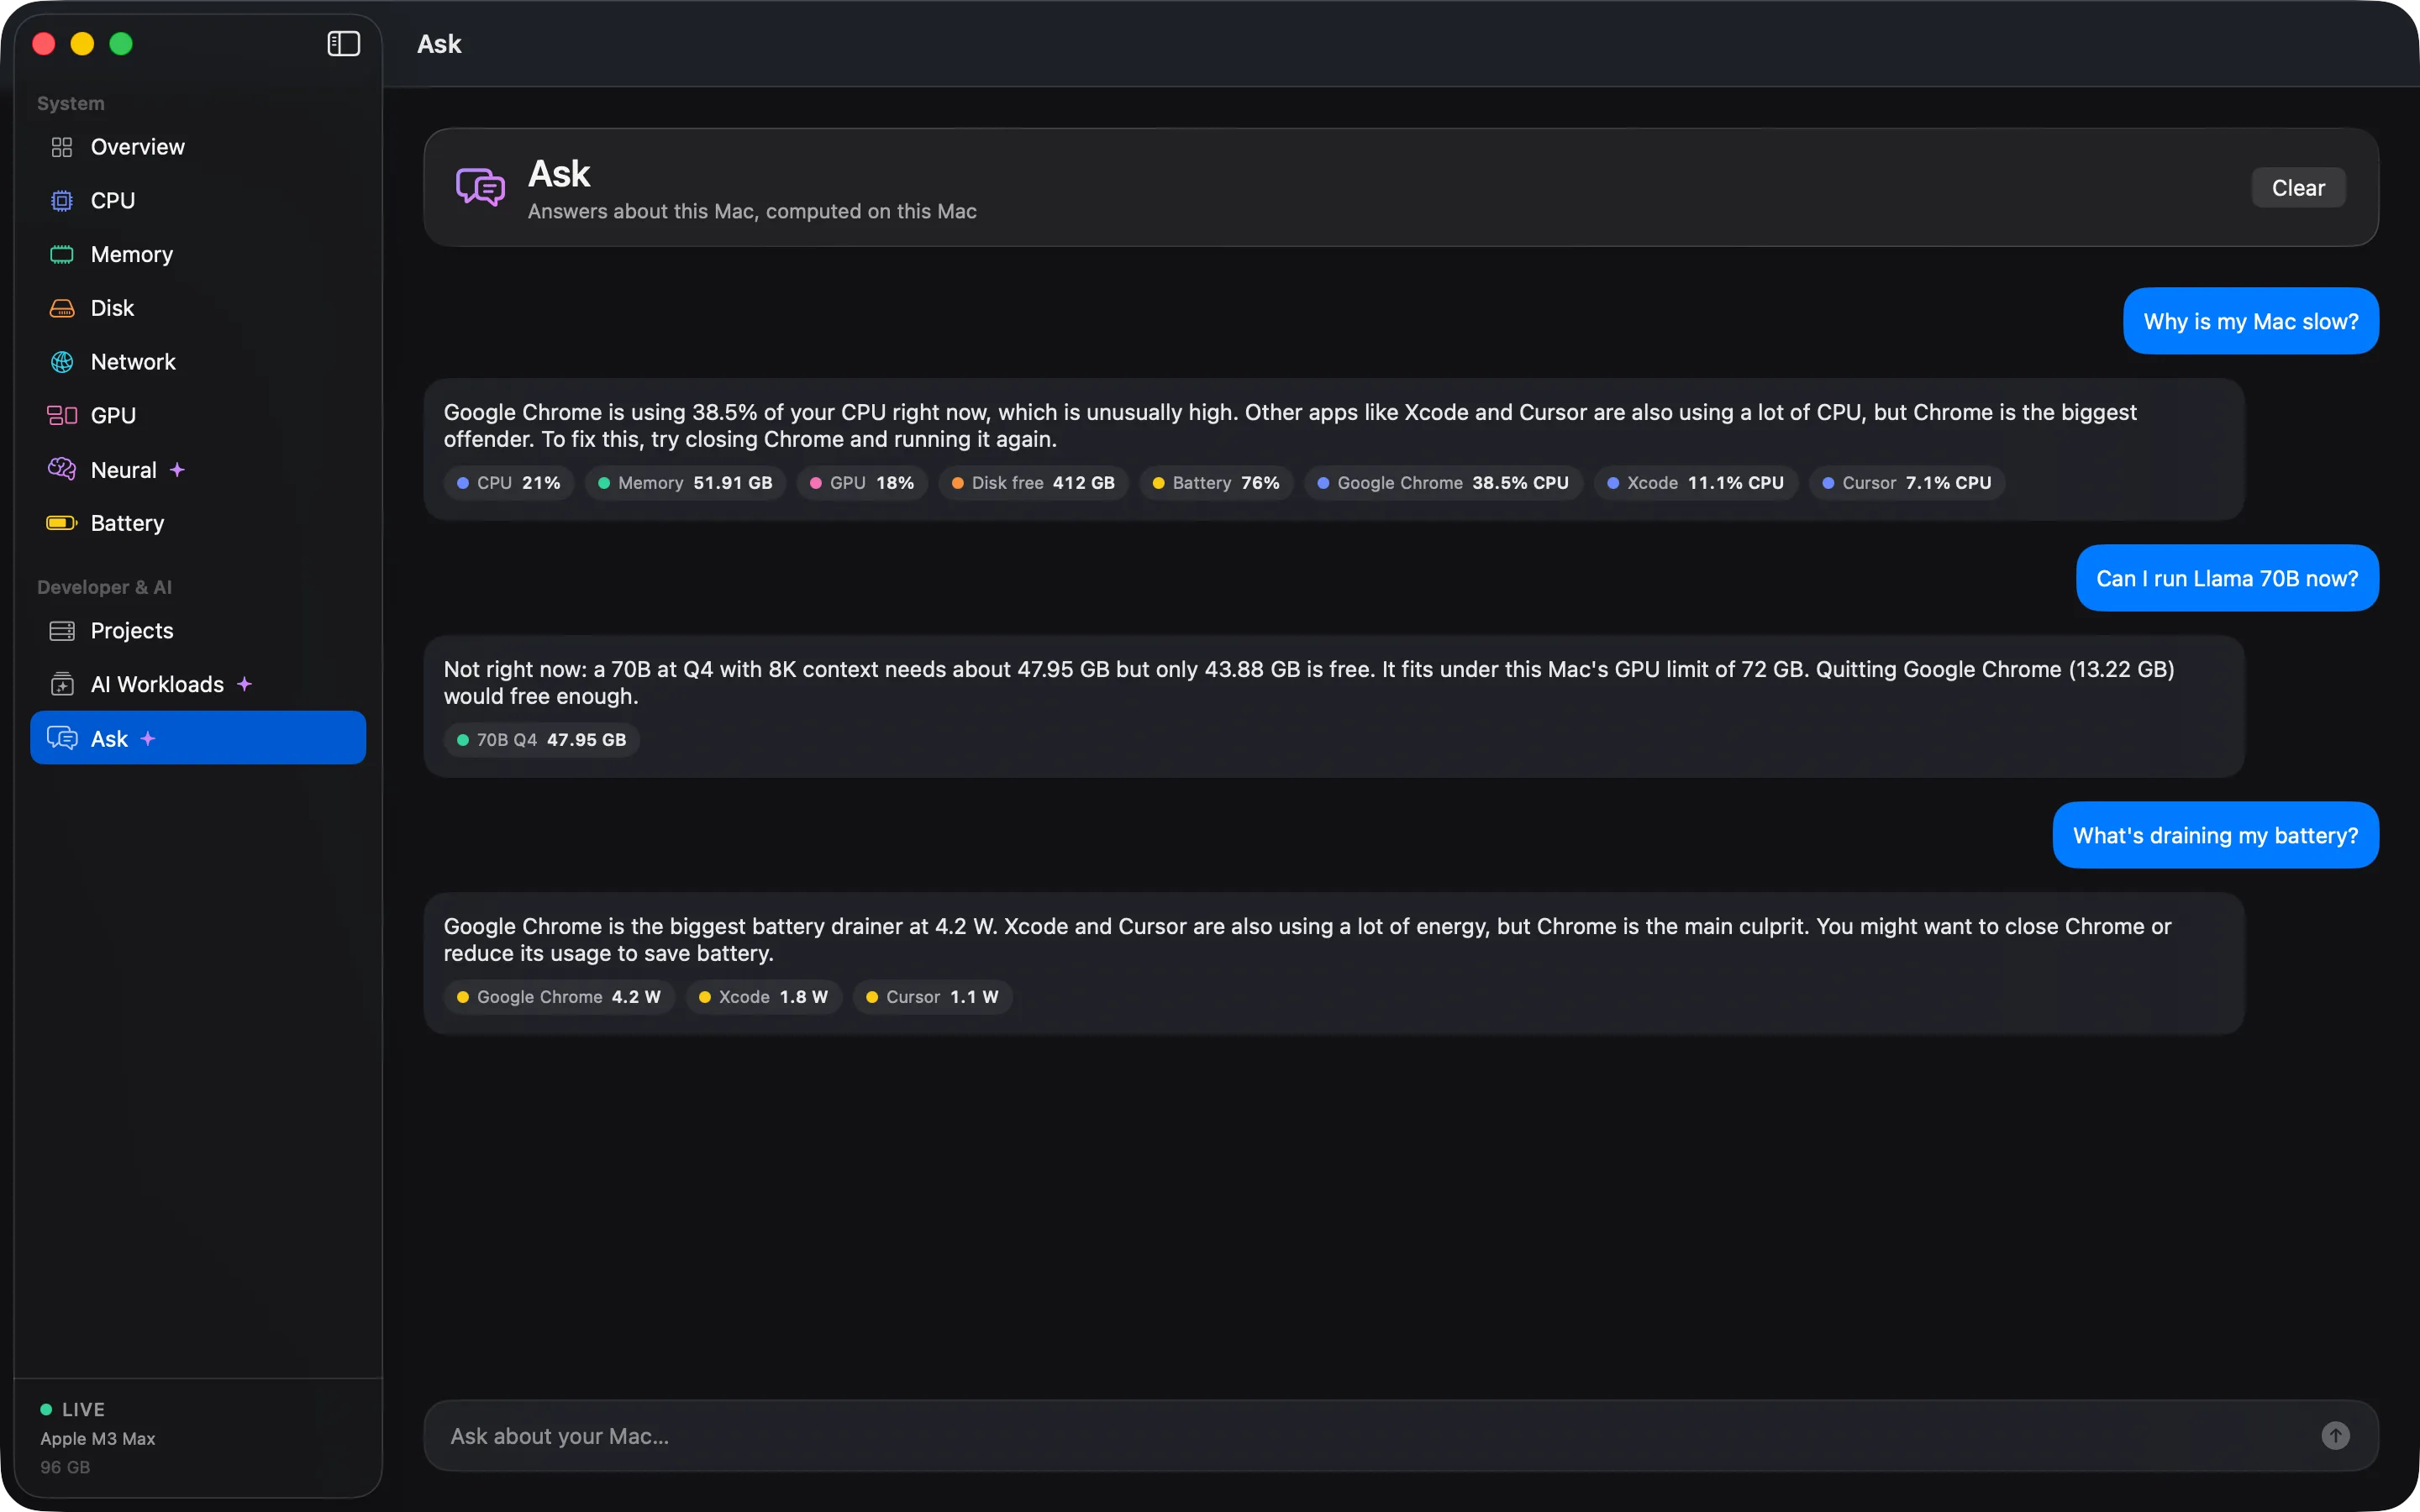
Ask "Why is my Mac slow?" or "What drained my battery?" and get an answer from your own data, on your Mac.

Ask Cortex uses Apple’s on-device Foundation Models to answer questions about your Mac in plain language: “Why is my Mac slow?”, “What drained my battery?”, “Can I run Llama 70B now?”

It needs macOS 26 and Apple Intelligence. On other Macs, a built-in rule-based assistant answers instead.

  • Runs on Apple Foundation Models, on device
  • Answers from your Mac's own history
  • Questions and answers never leave the Mac
Ask Cortex answering the question "Why is my Mac slow?" with the apps responsible.Ask Cortex answering the question "Why is my Mac slow?" with the apps responsible.
03

Every part of your Mac

CPU, memory, disk, network, GPU, battery and thermals, each with 30 days of history.

CPU

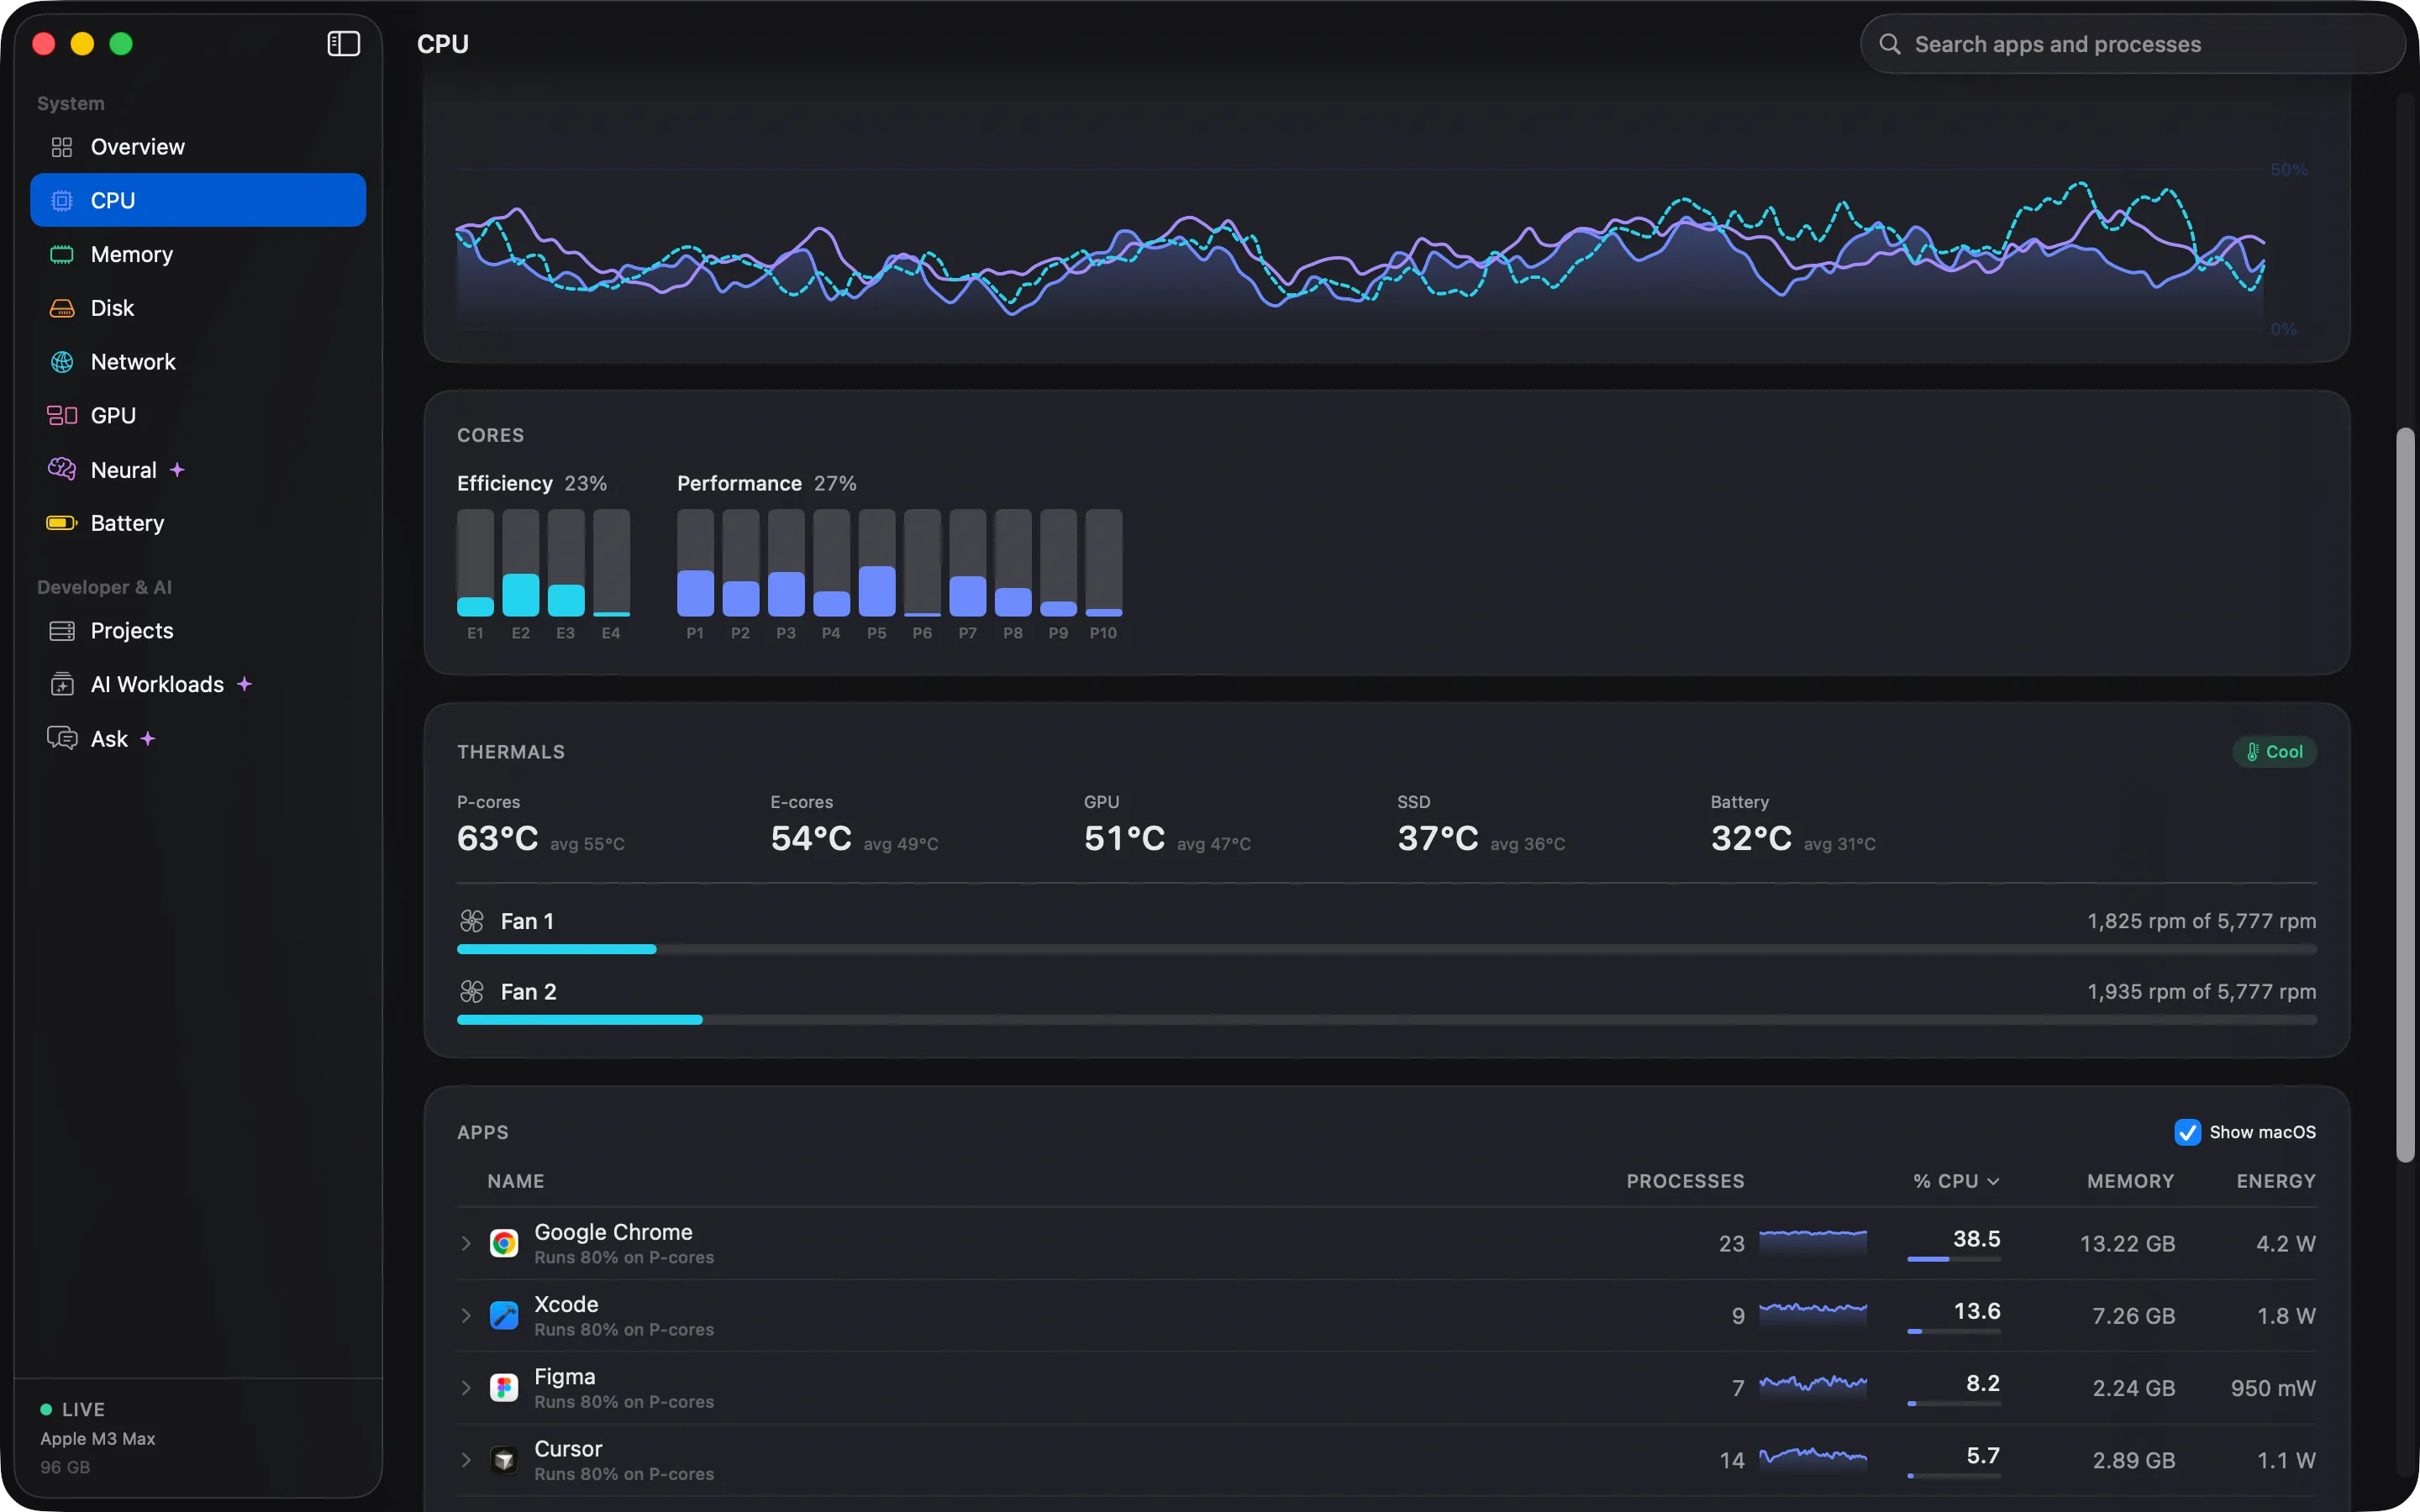
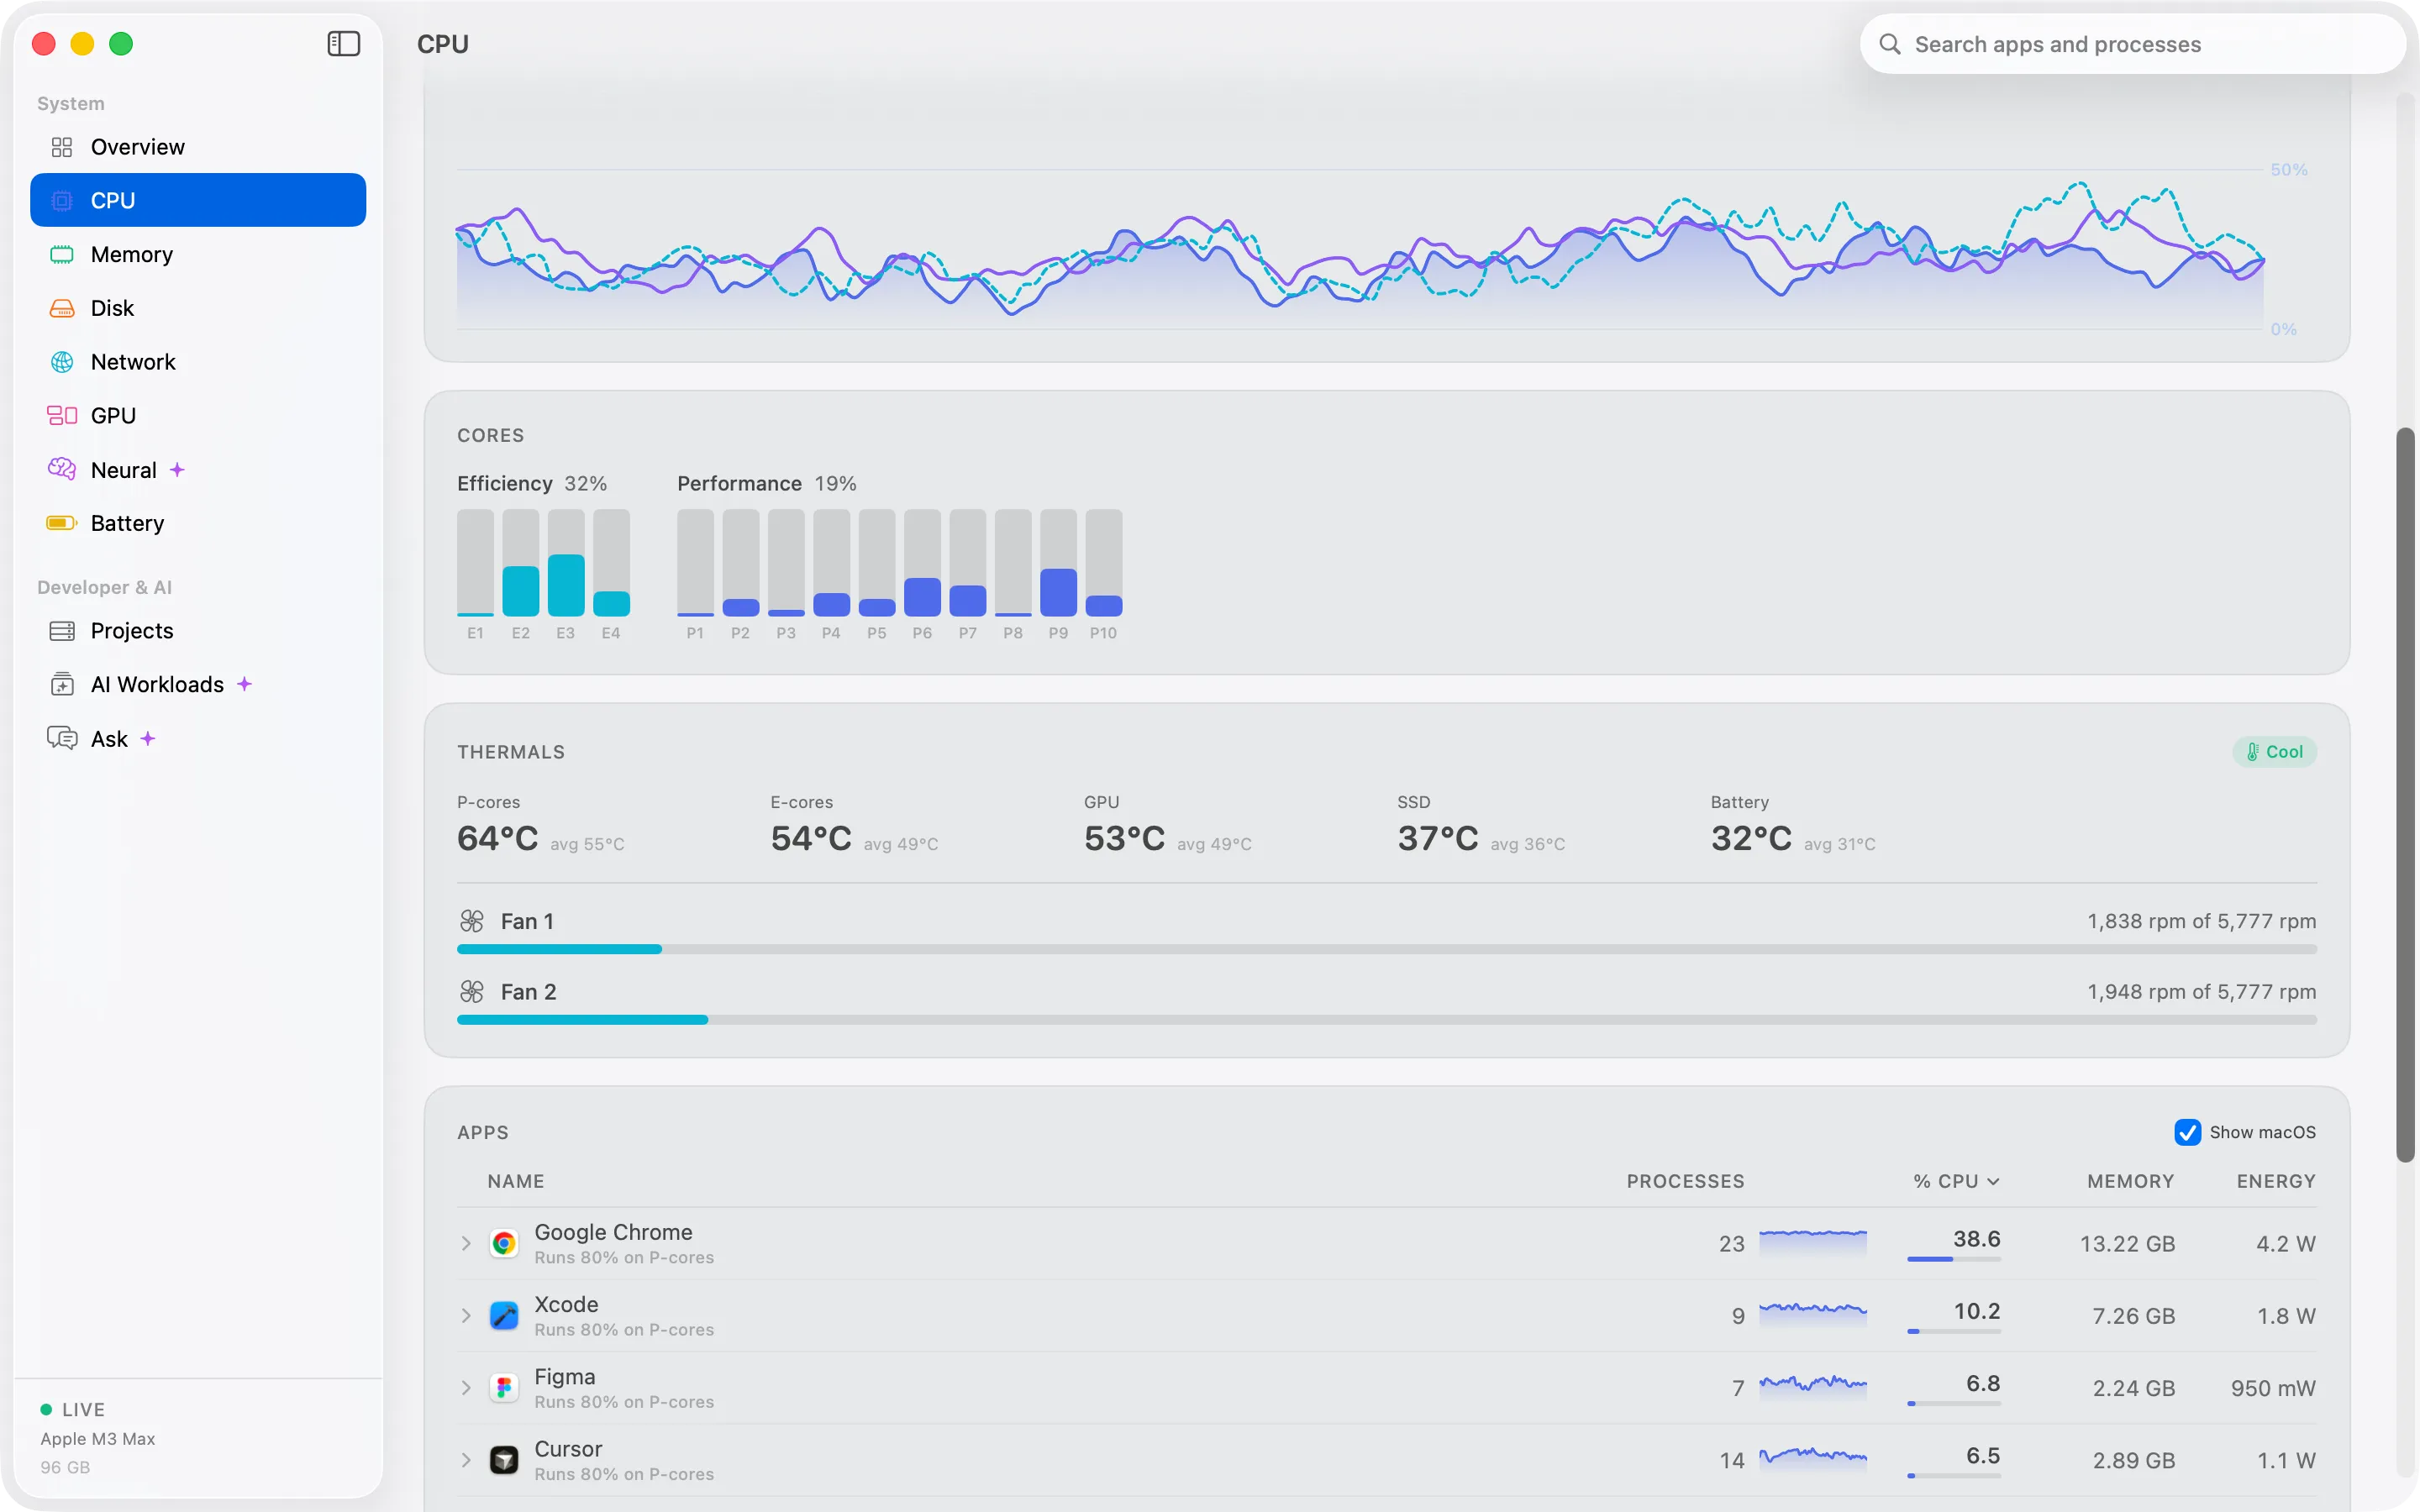
CPU, core by core

Performance cores and efficiency cores, shown separately, so you know which kind of work is running.

Apple Silicon splits work between performance and efficiency cores. Cortex shows both, so you can tell a background task from a real slowdown.

  • P-cores and E-cores side by side
  • The apps using the most CPU, right now and over time
The Cortex CPU screen showing load on performance cores and efficiency cores.The Cortex CPU screen showing load on performance cores and efficiency cores.

Memory

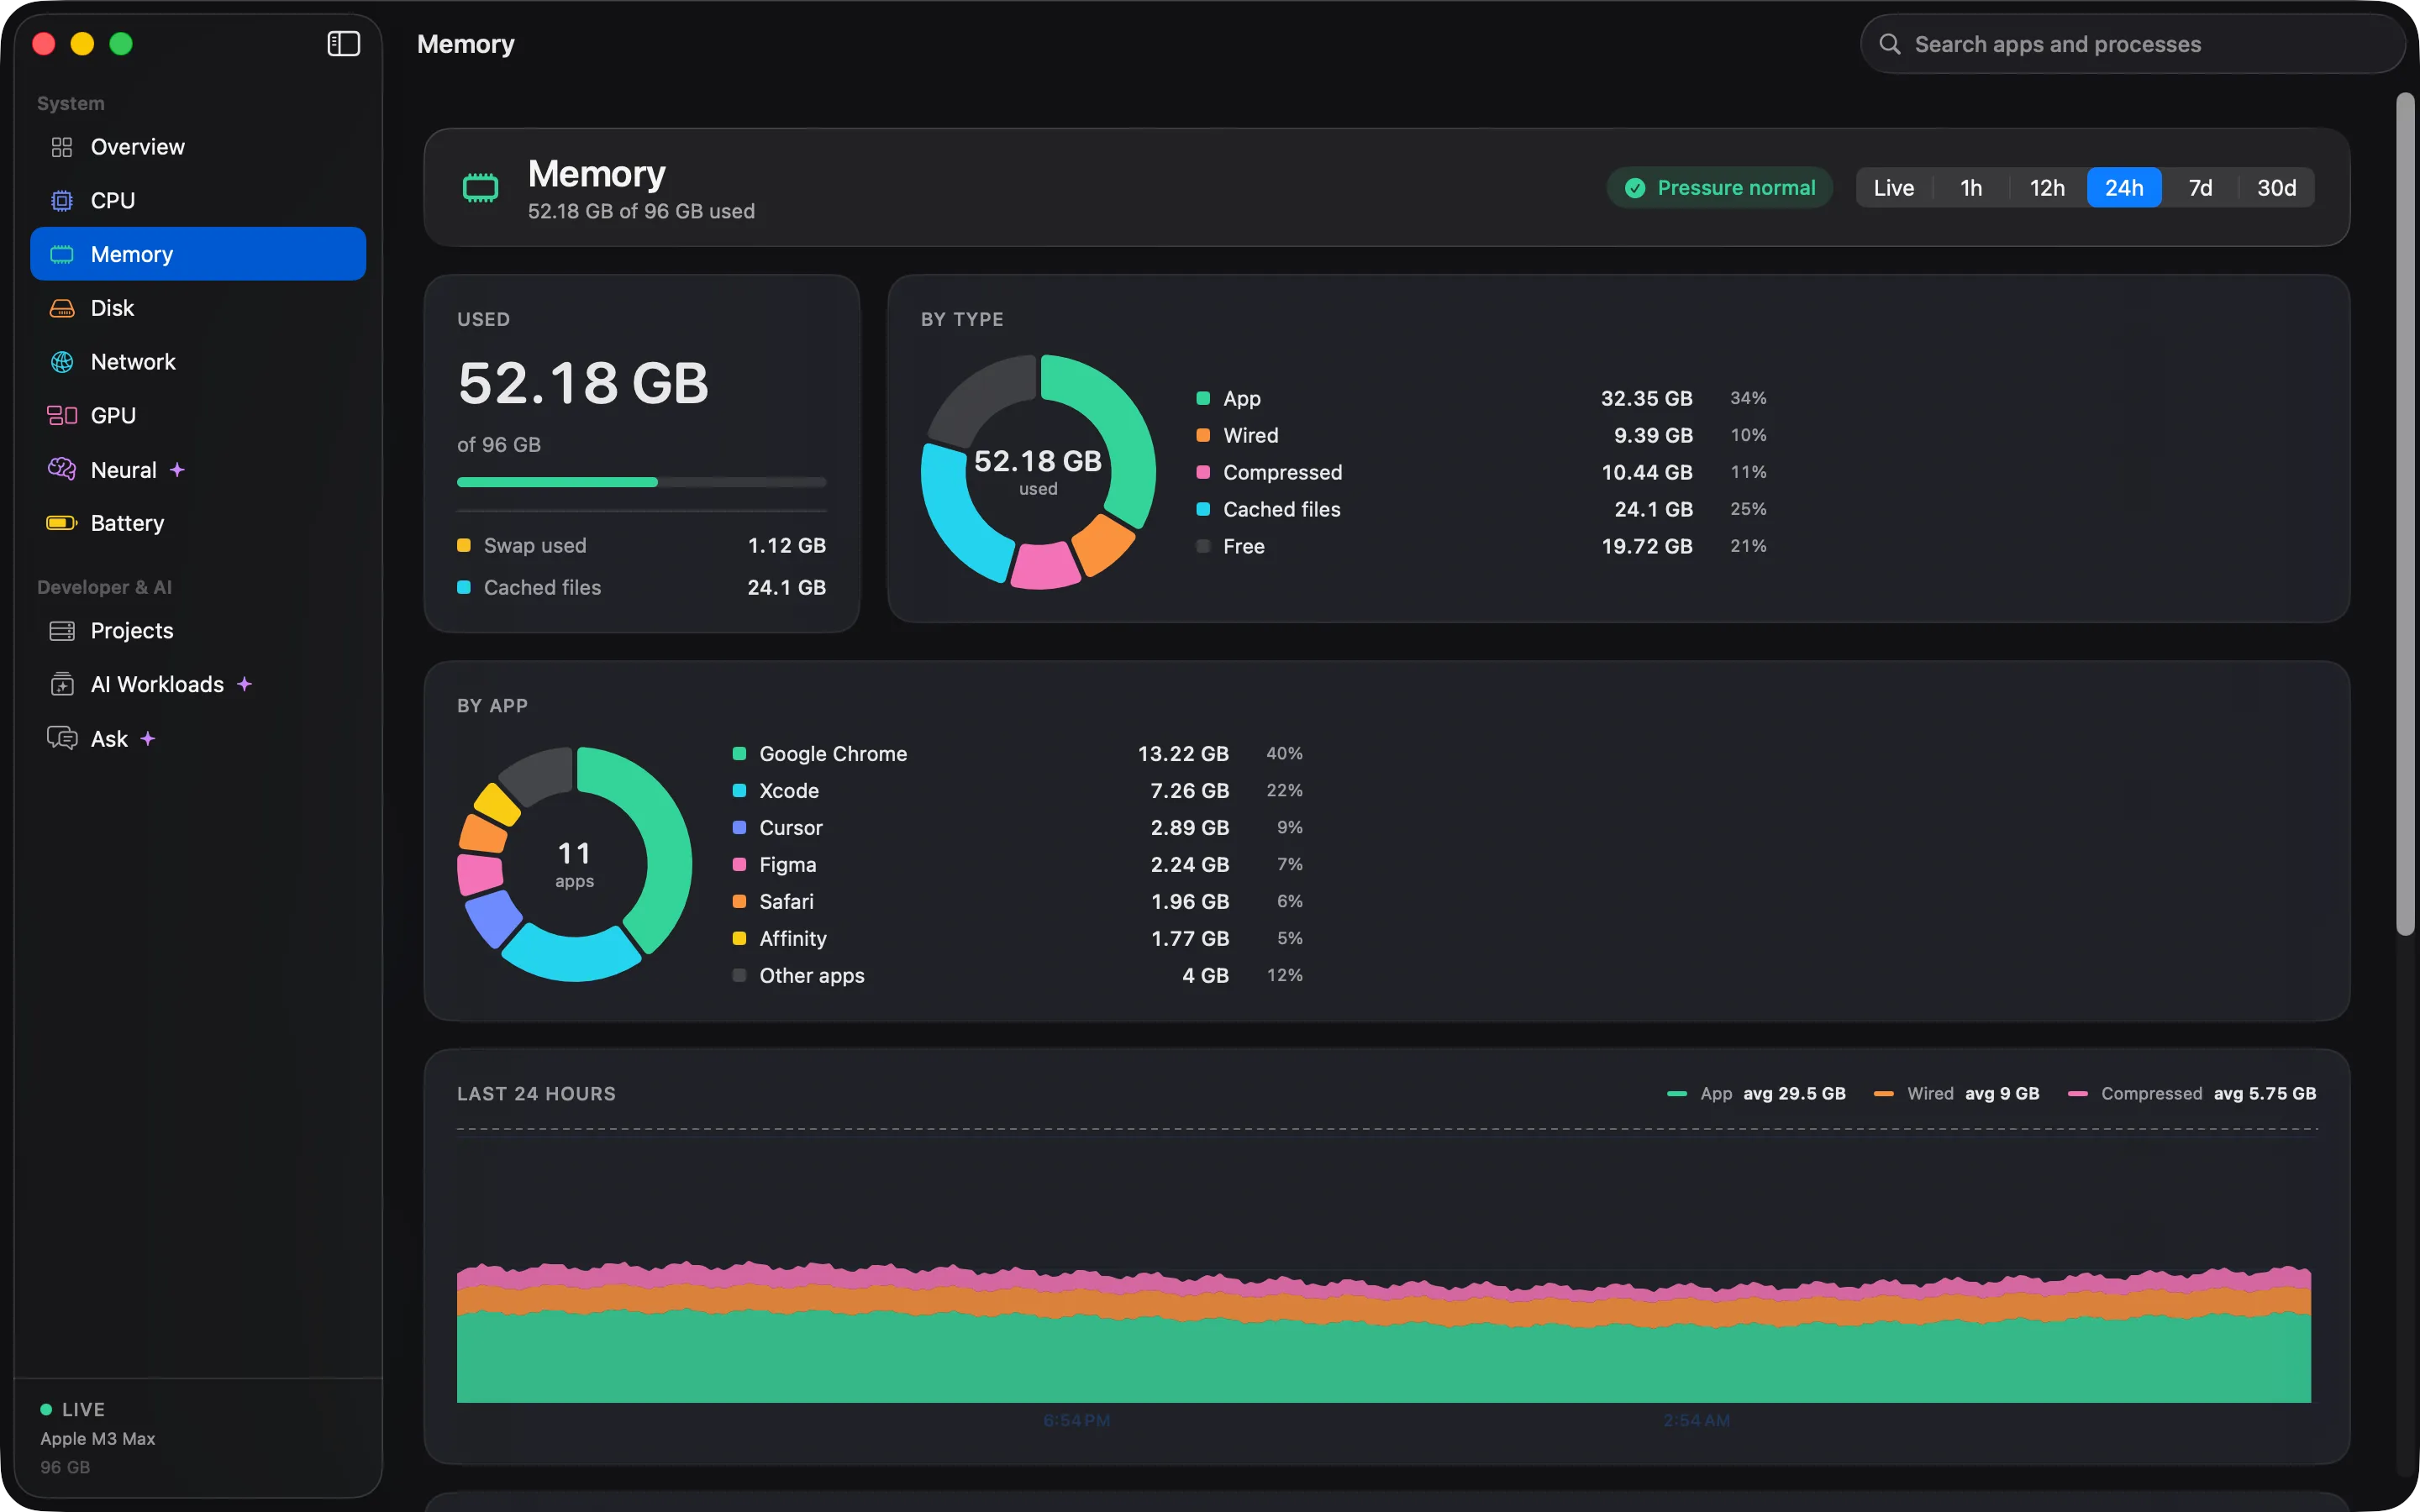
Memory that makes sense

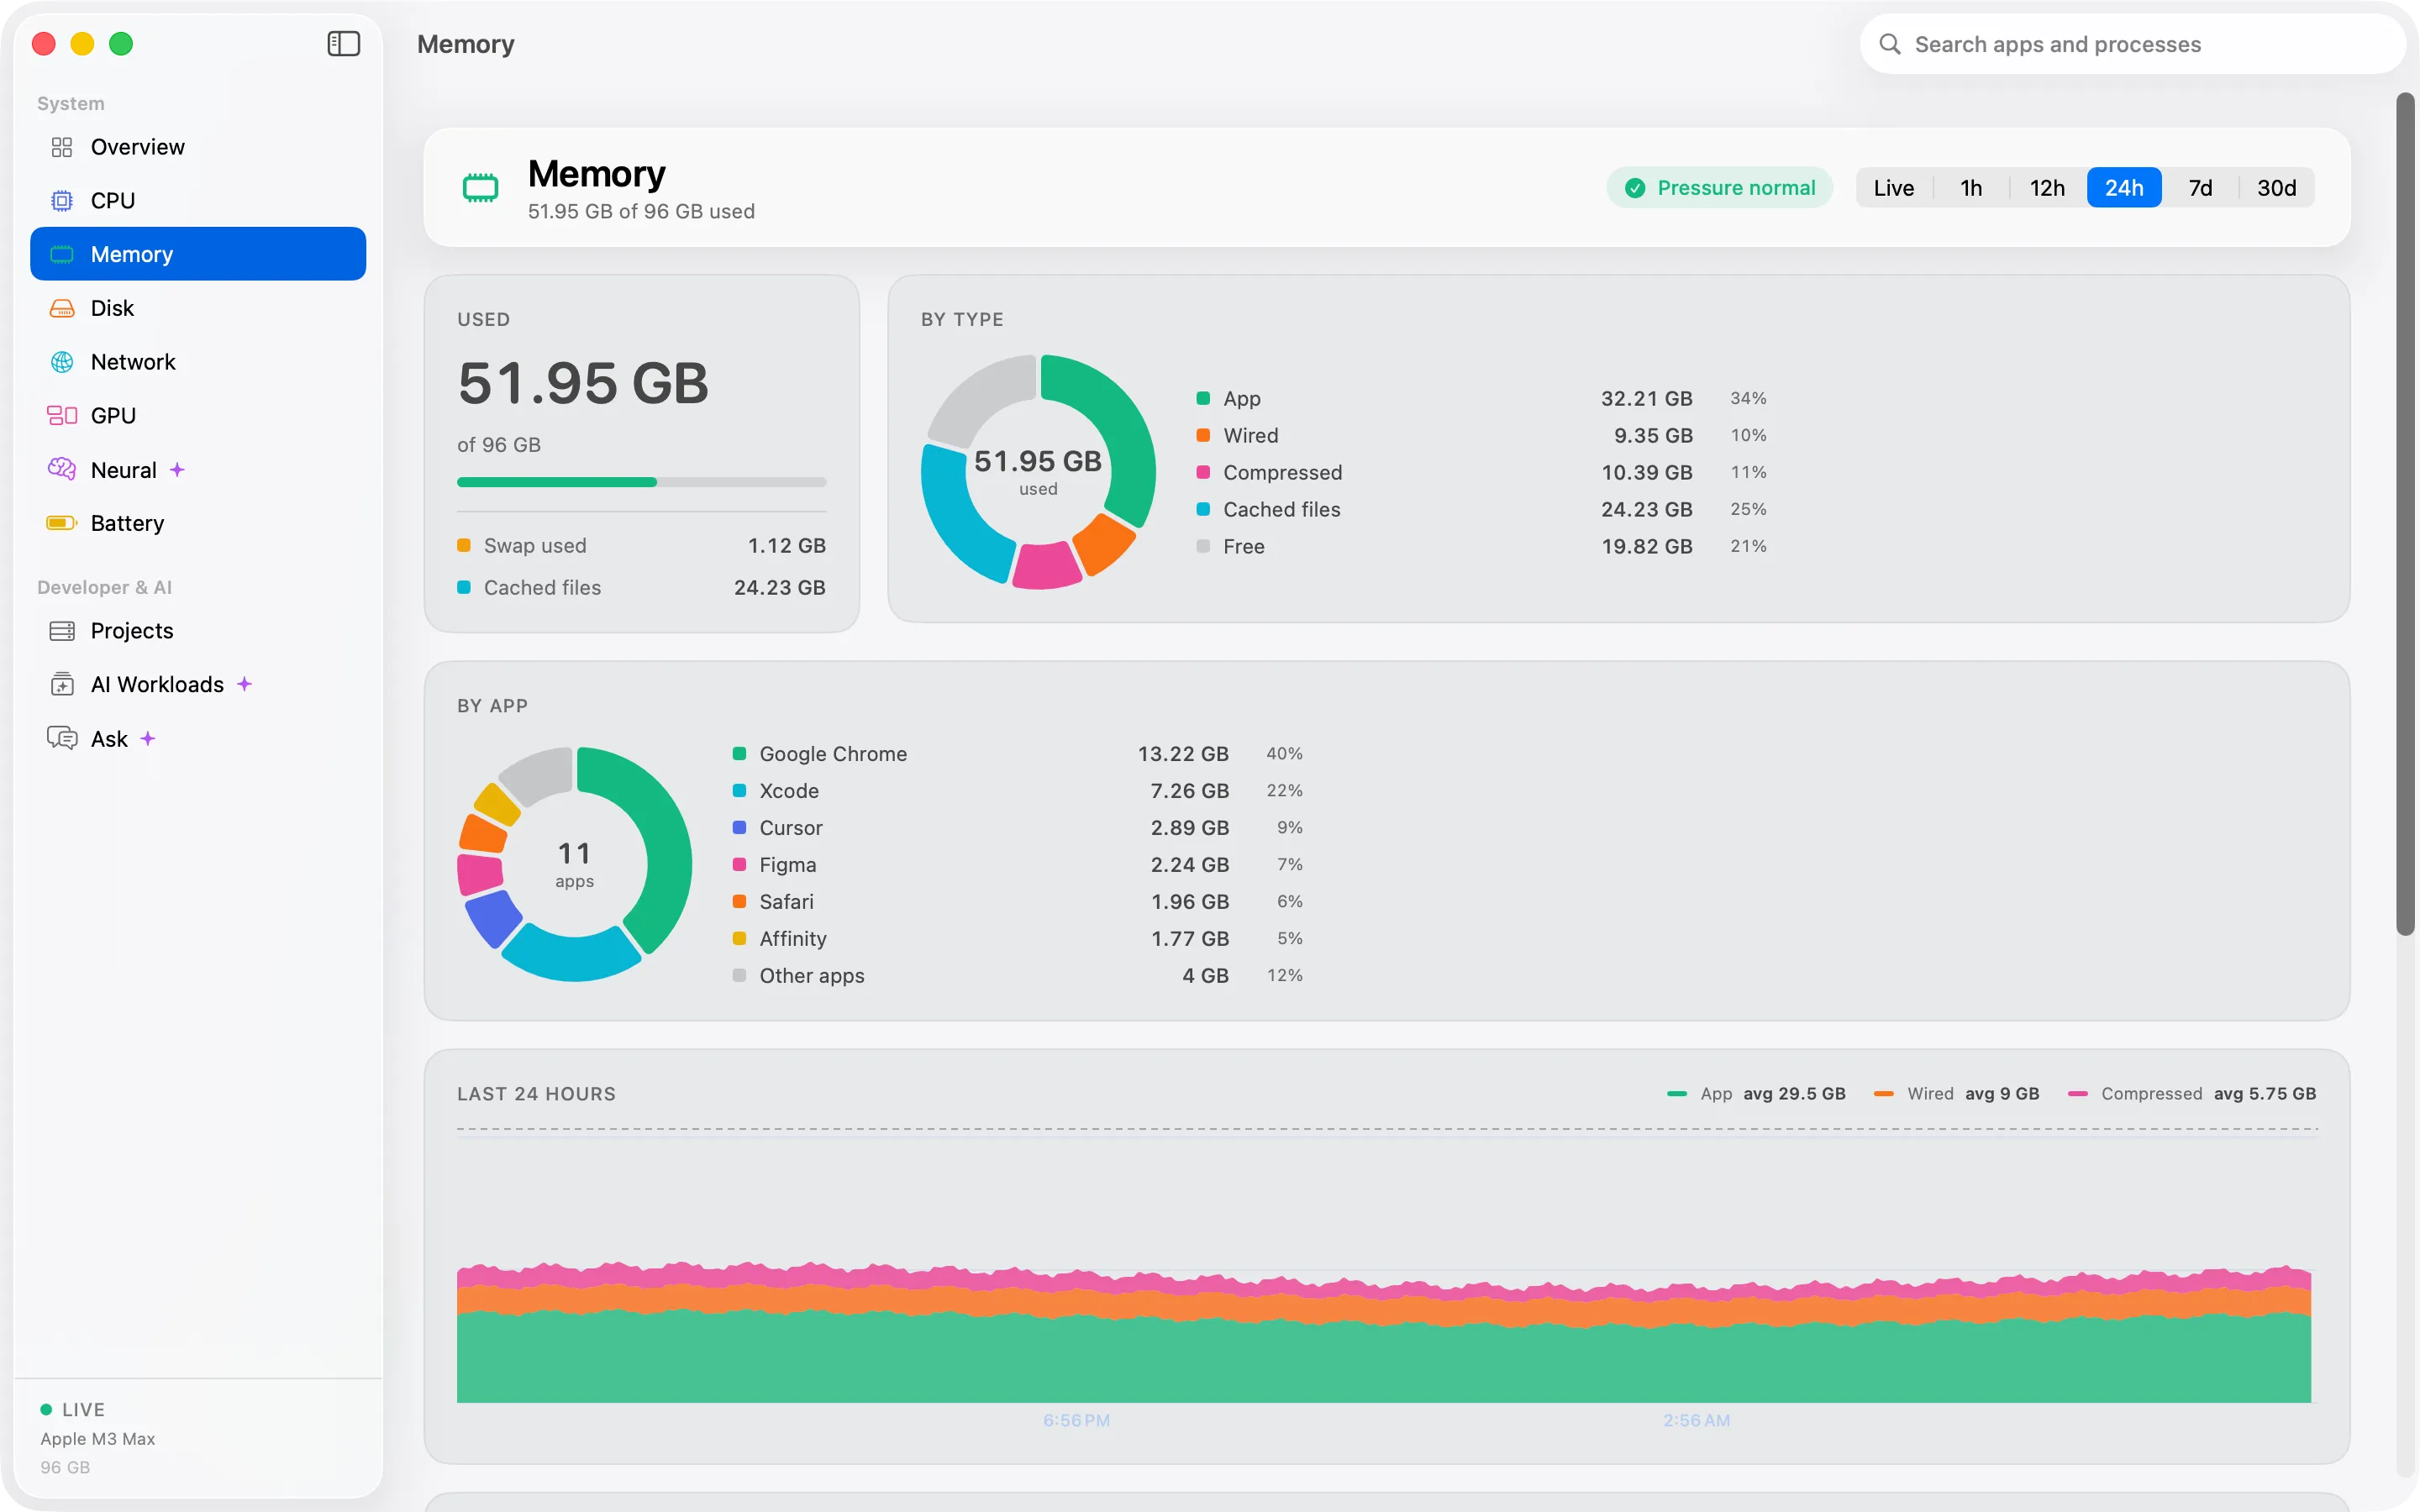
Memory pressure, swap and a clear breakdown of where your unified memory went.

Free memory is not the right question on a Mac. Pressure is. Cortex puts pressure first, then shows swap and exactly what is using the rest.

  • Memory pressure, the number that matters
  • Swap use
  • A breakdown of app, wired and compressed memory
The Cortex memory screen showing memory pressure, swap use and a breakdown by type.The Cortex memory screen showing memory pressure, swap use and a breakdown by type.

Disk and network

Disk and network

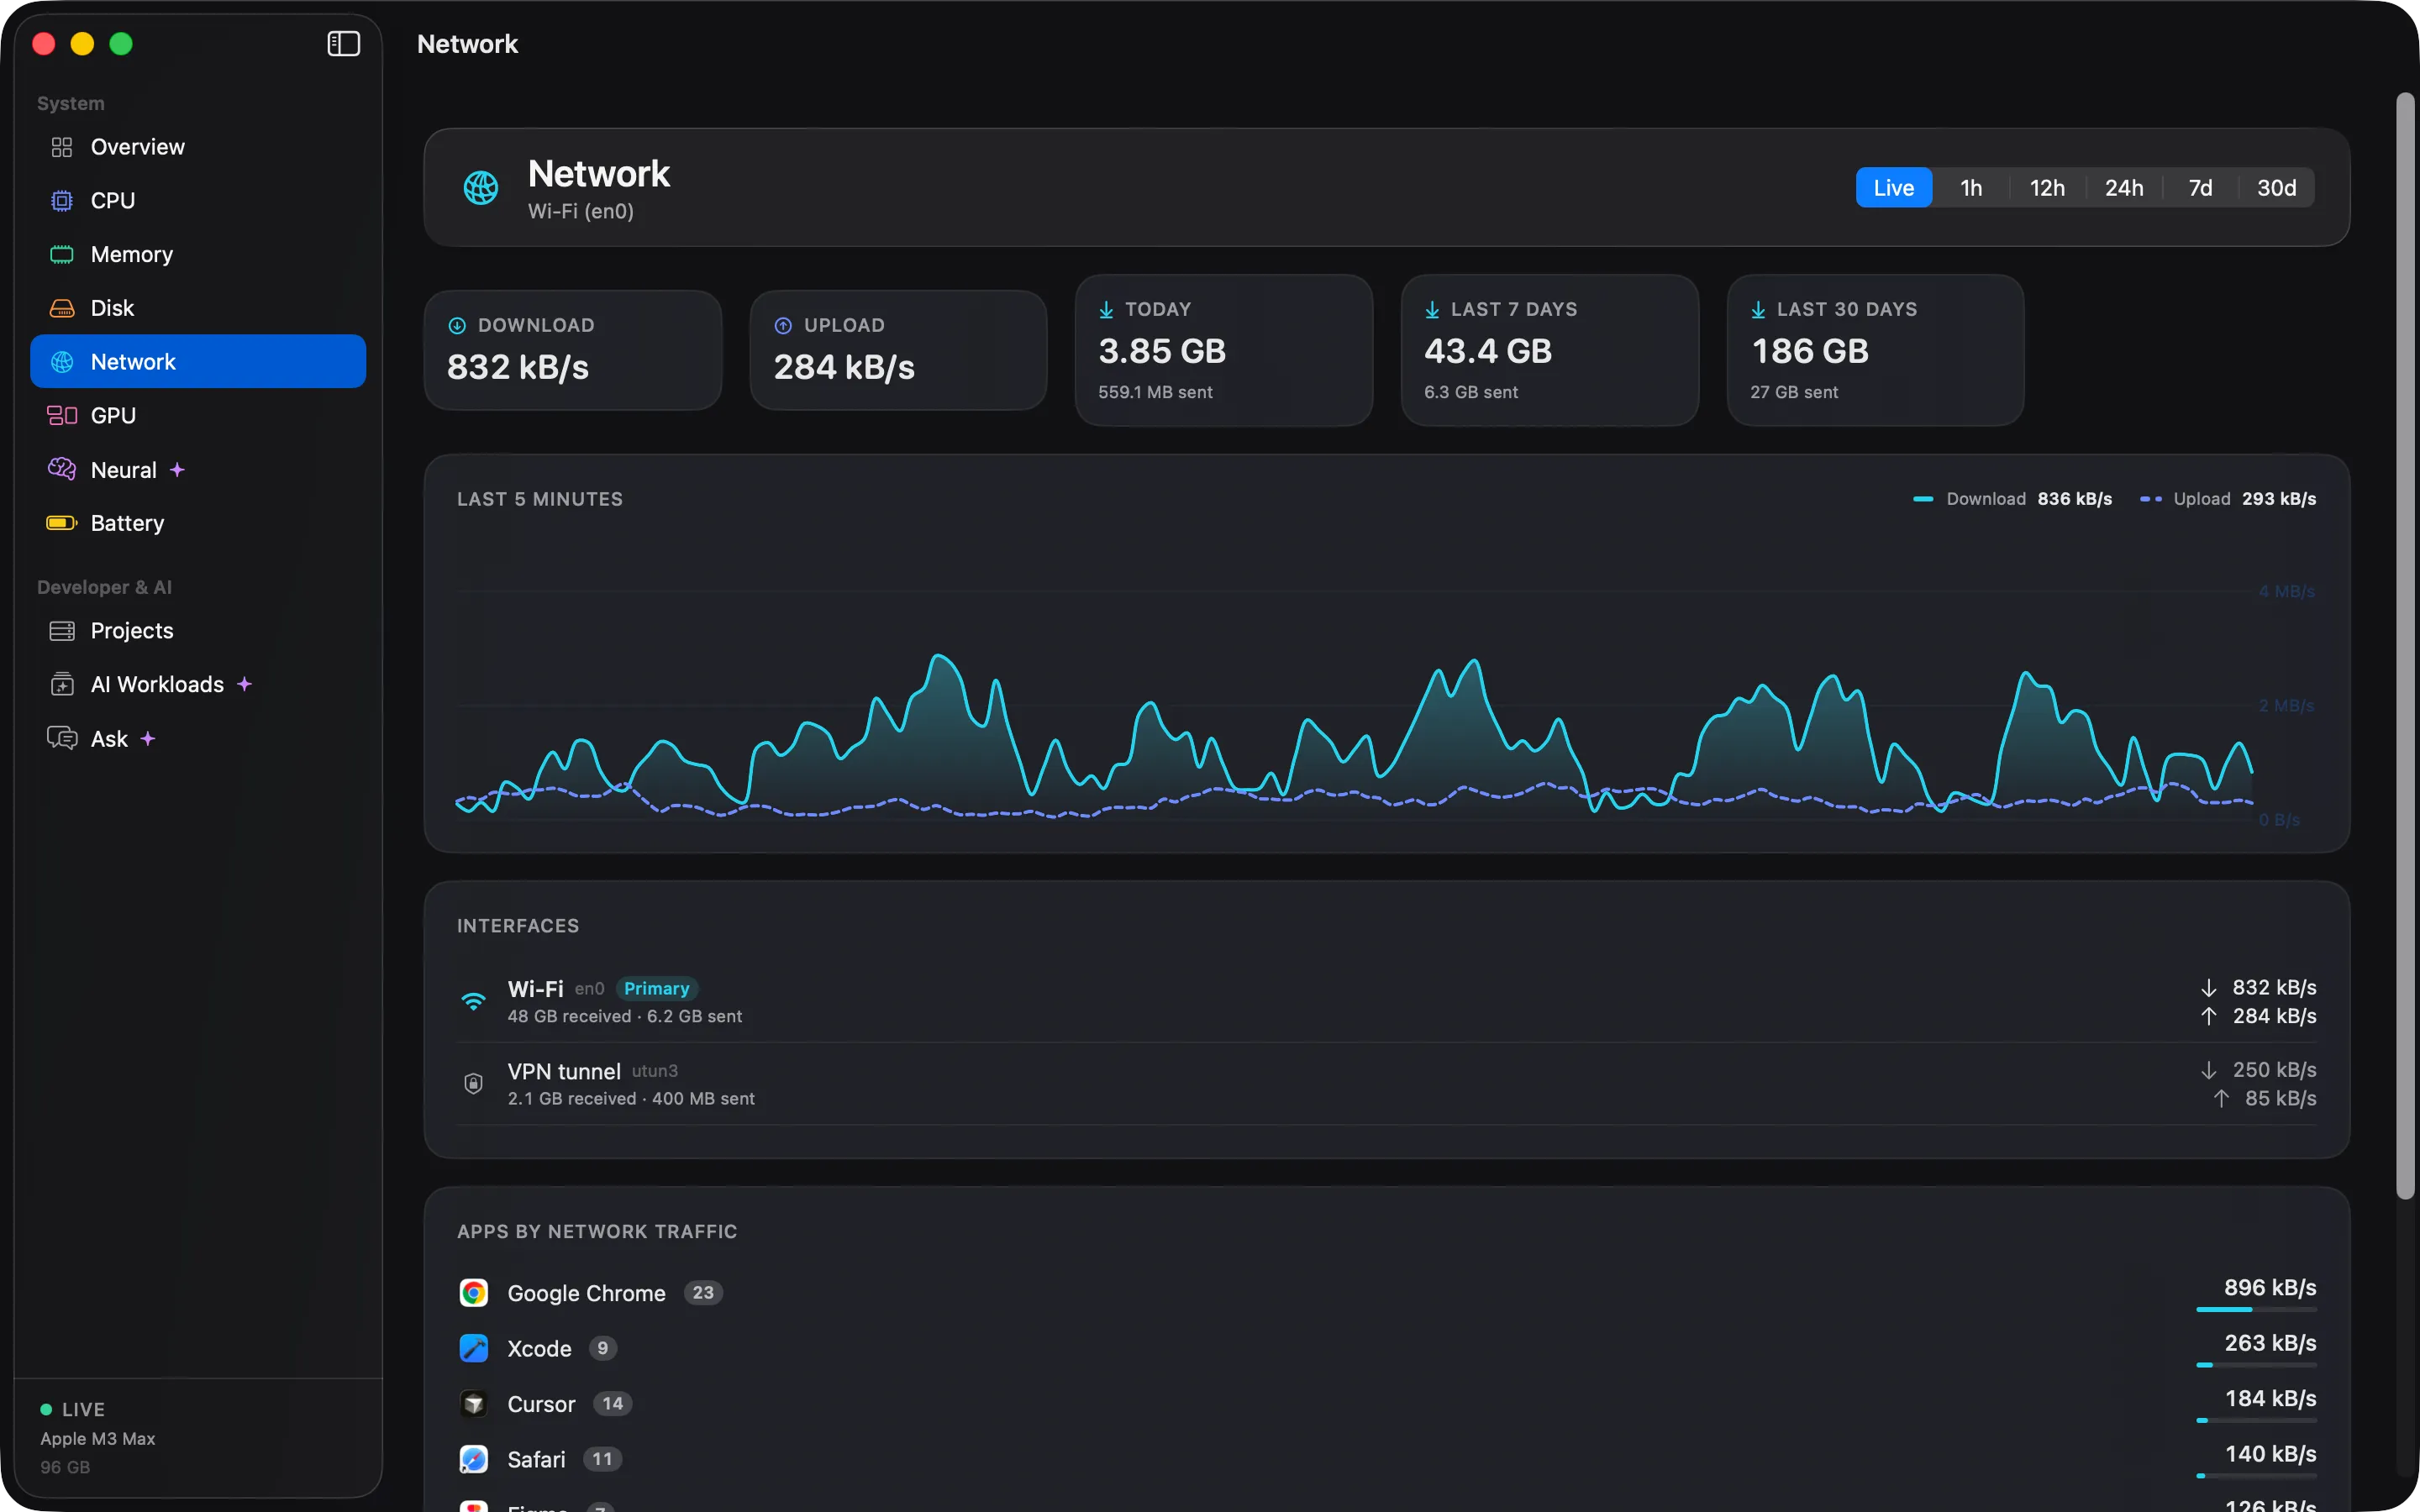
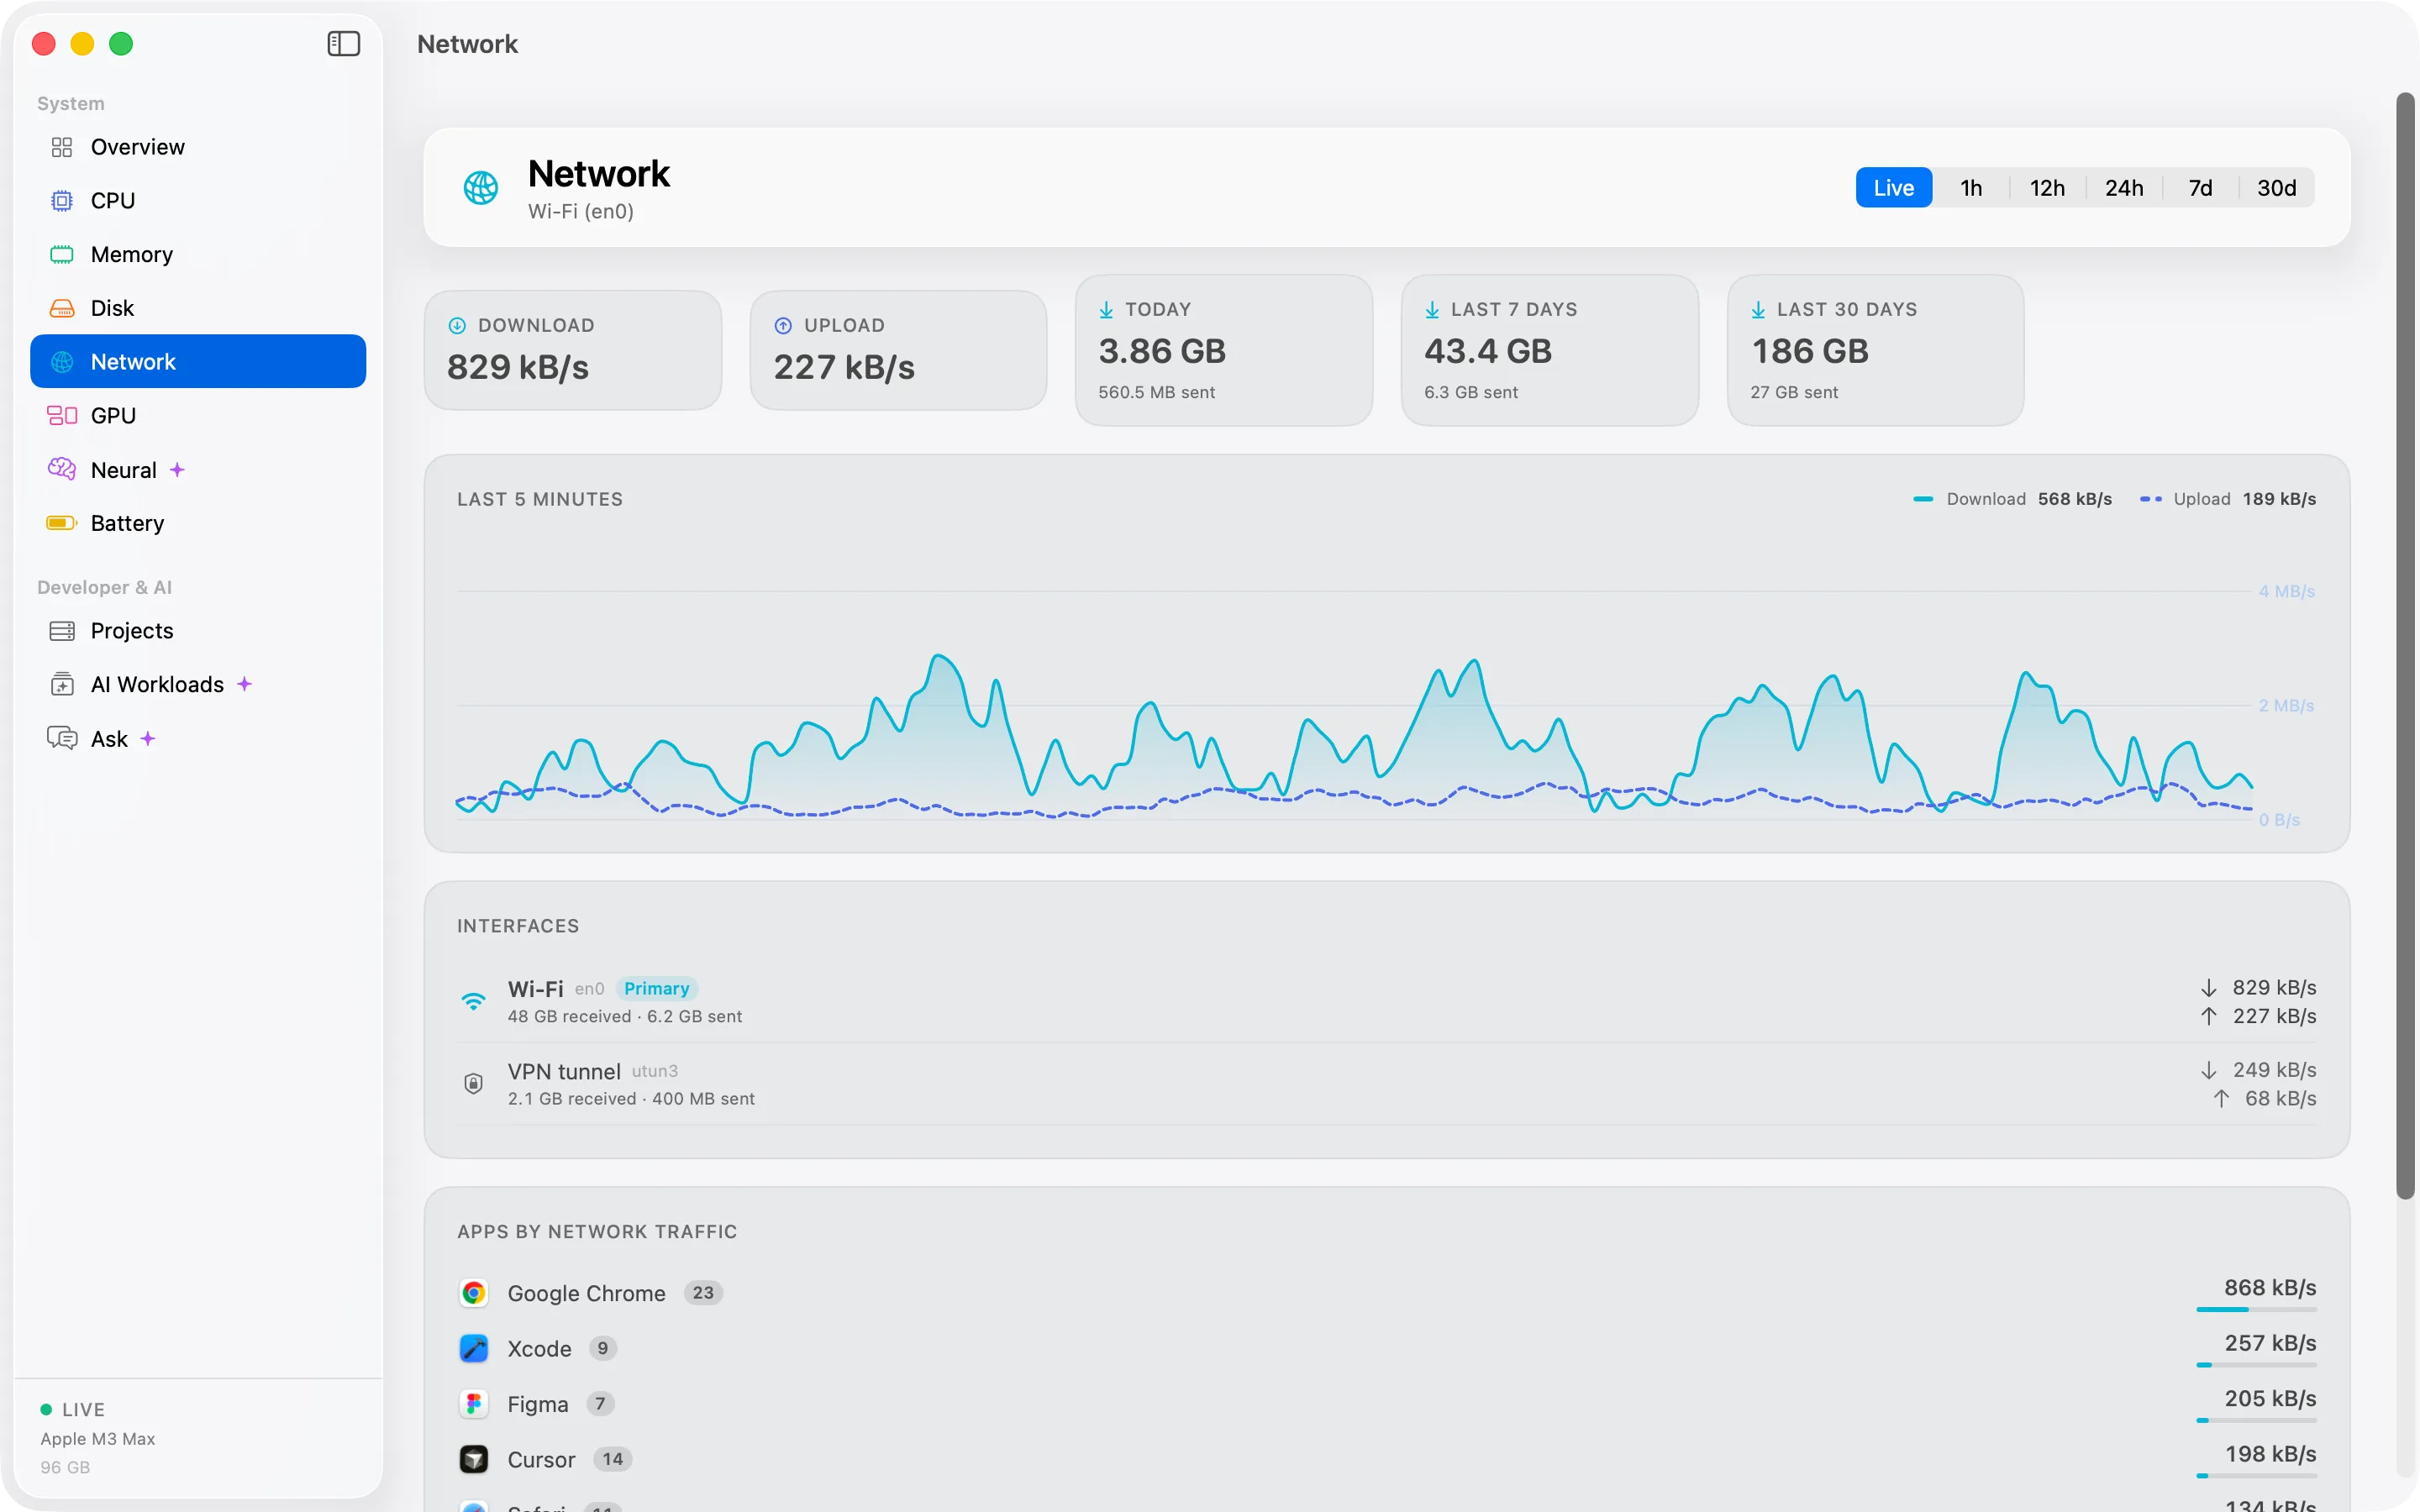
Reads, writes and traffic per app, so you can see who is hammering the disk or the network.

When the fans spin up for no reason, it is often an app writing or syncing in the background. Cortex names it.

  • Disk reads and writes per app
  • Network upload and download per app
The Cortex disk and network screens showing reads, writes and traffic per app.The Cortex disk and network screens showing reads, writes and traffic per app.

GPU

GPU

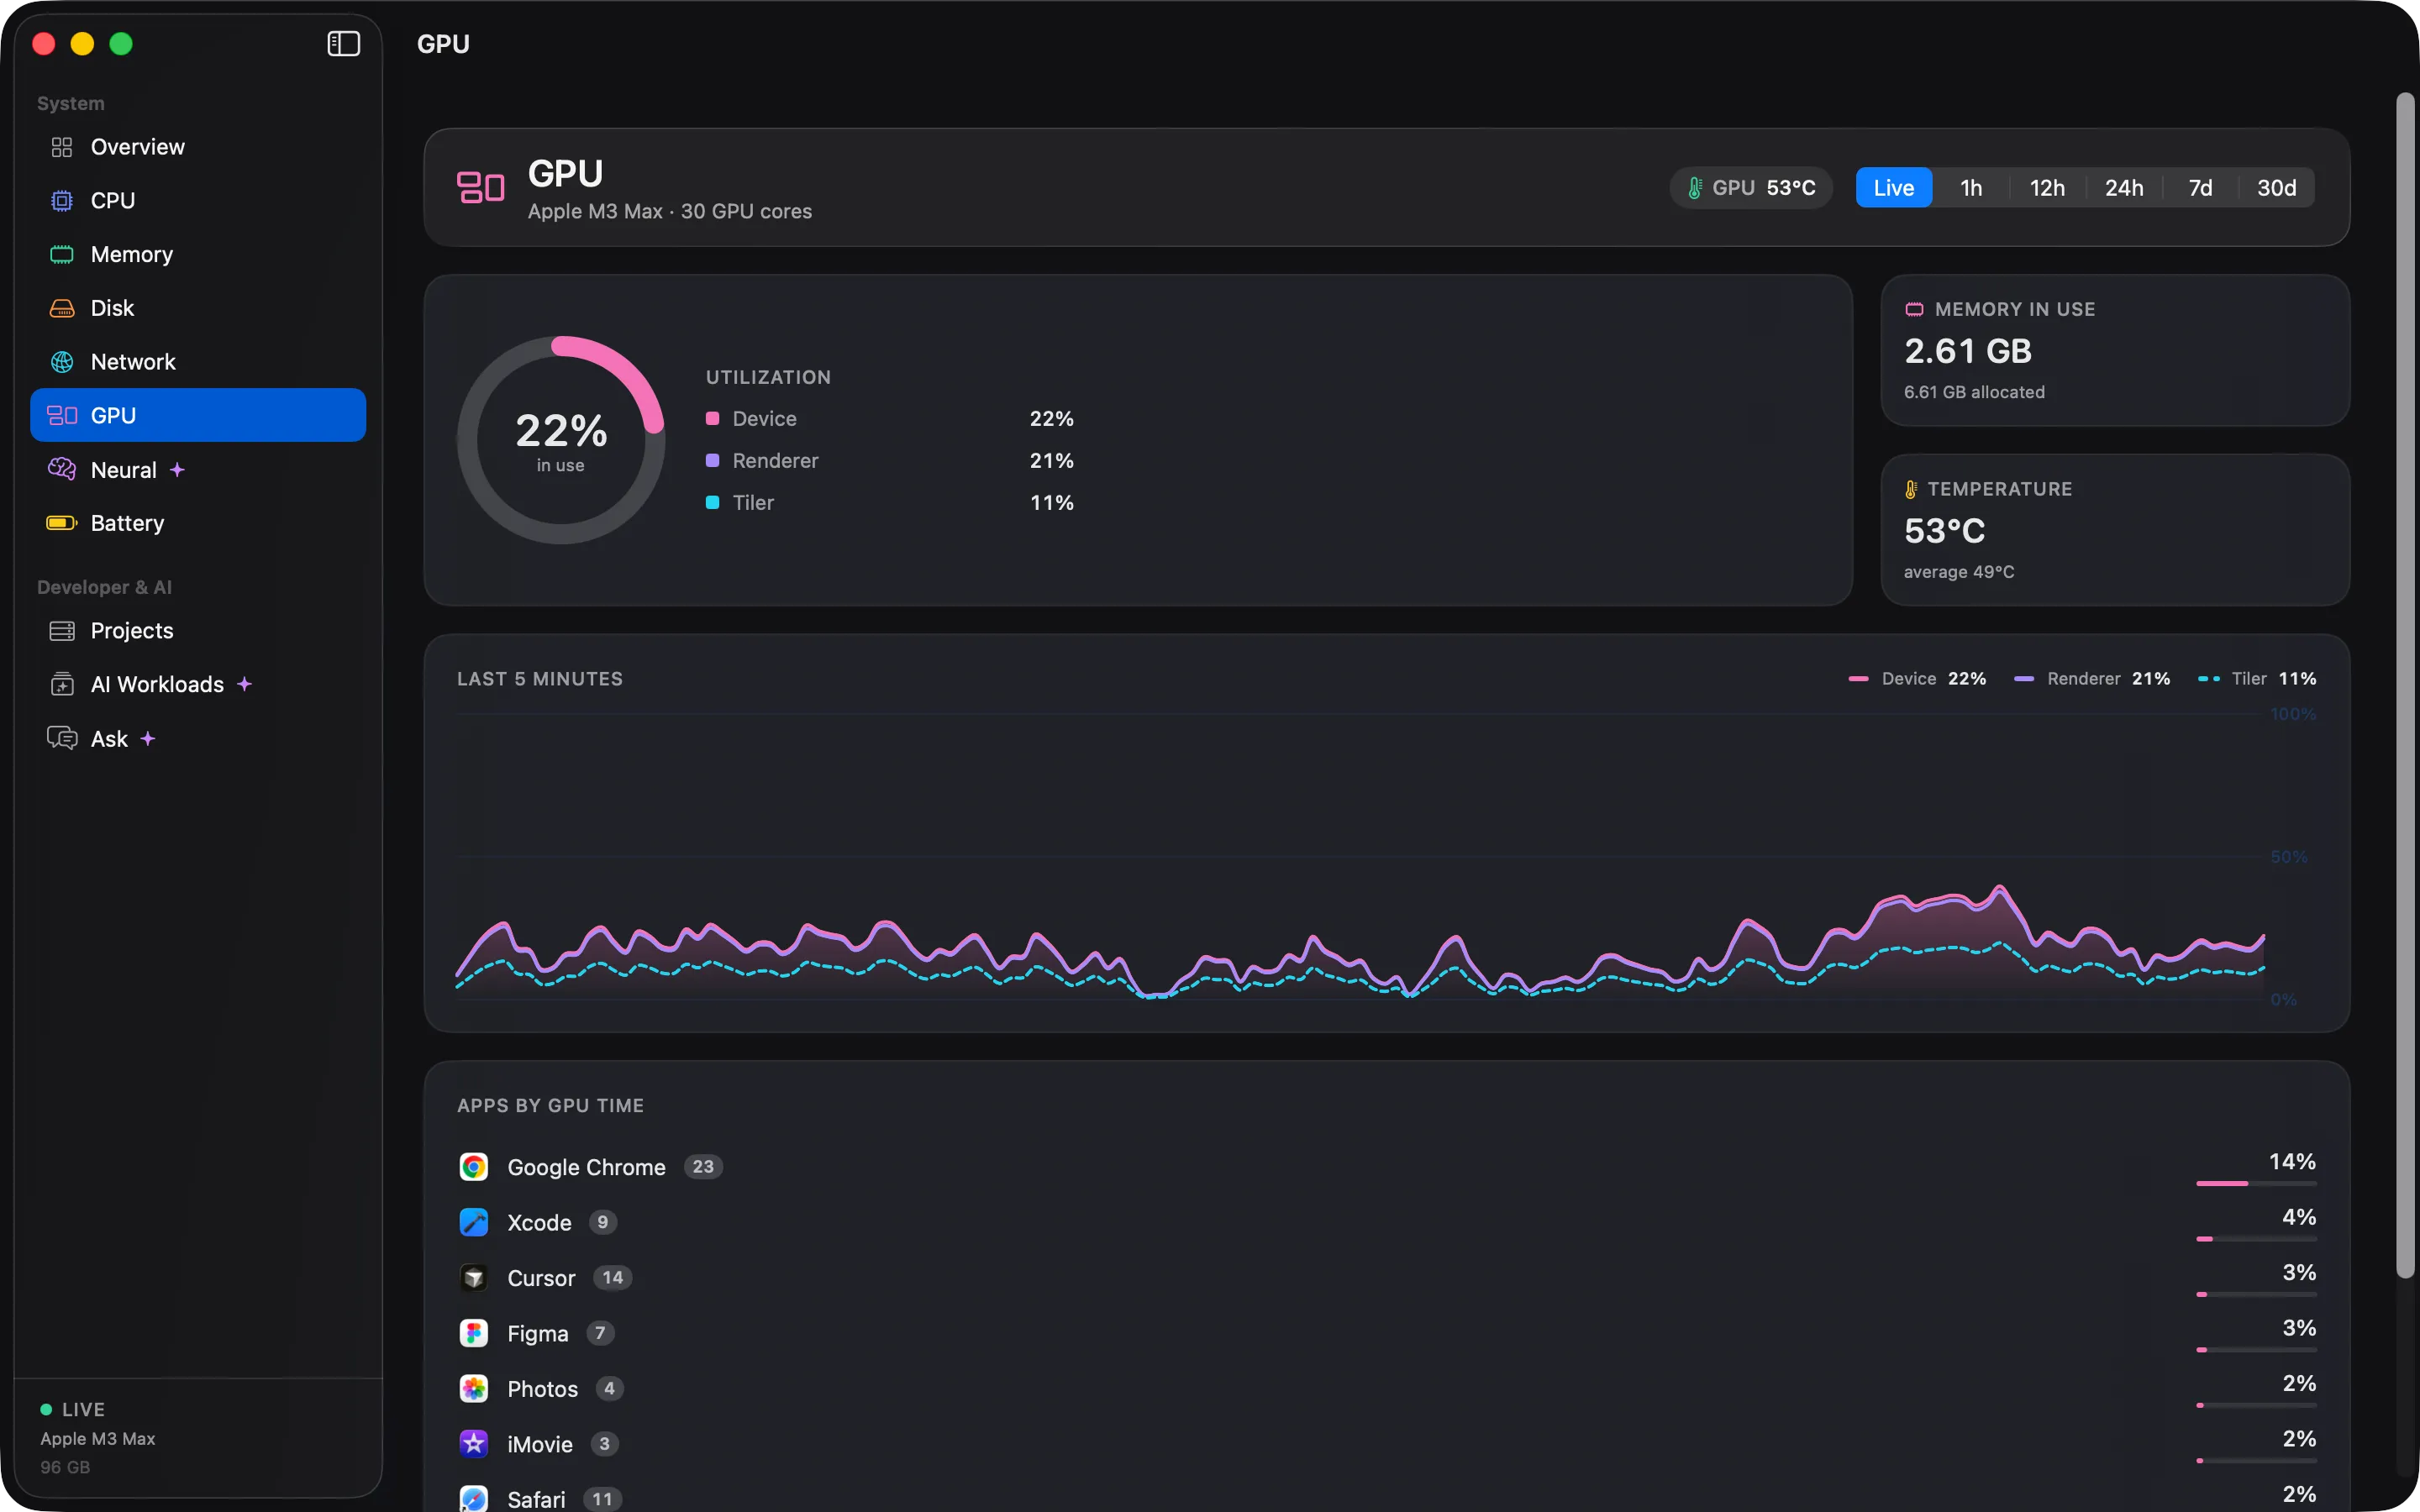
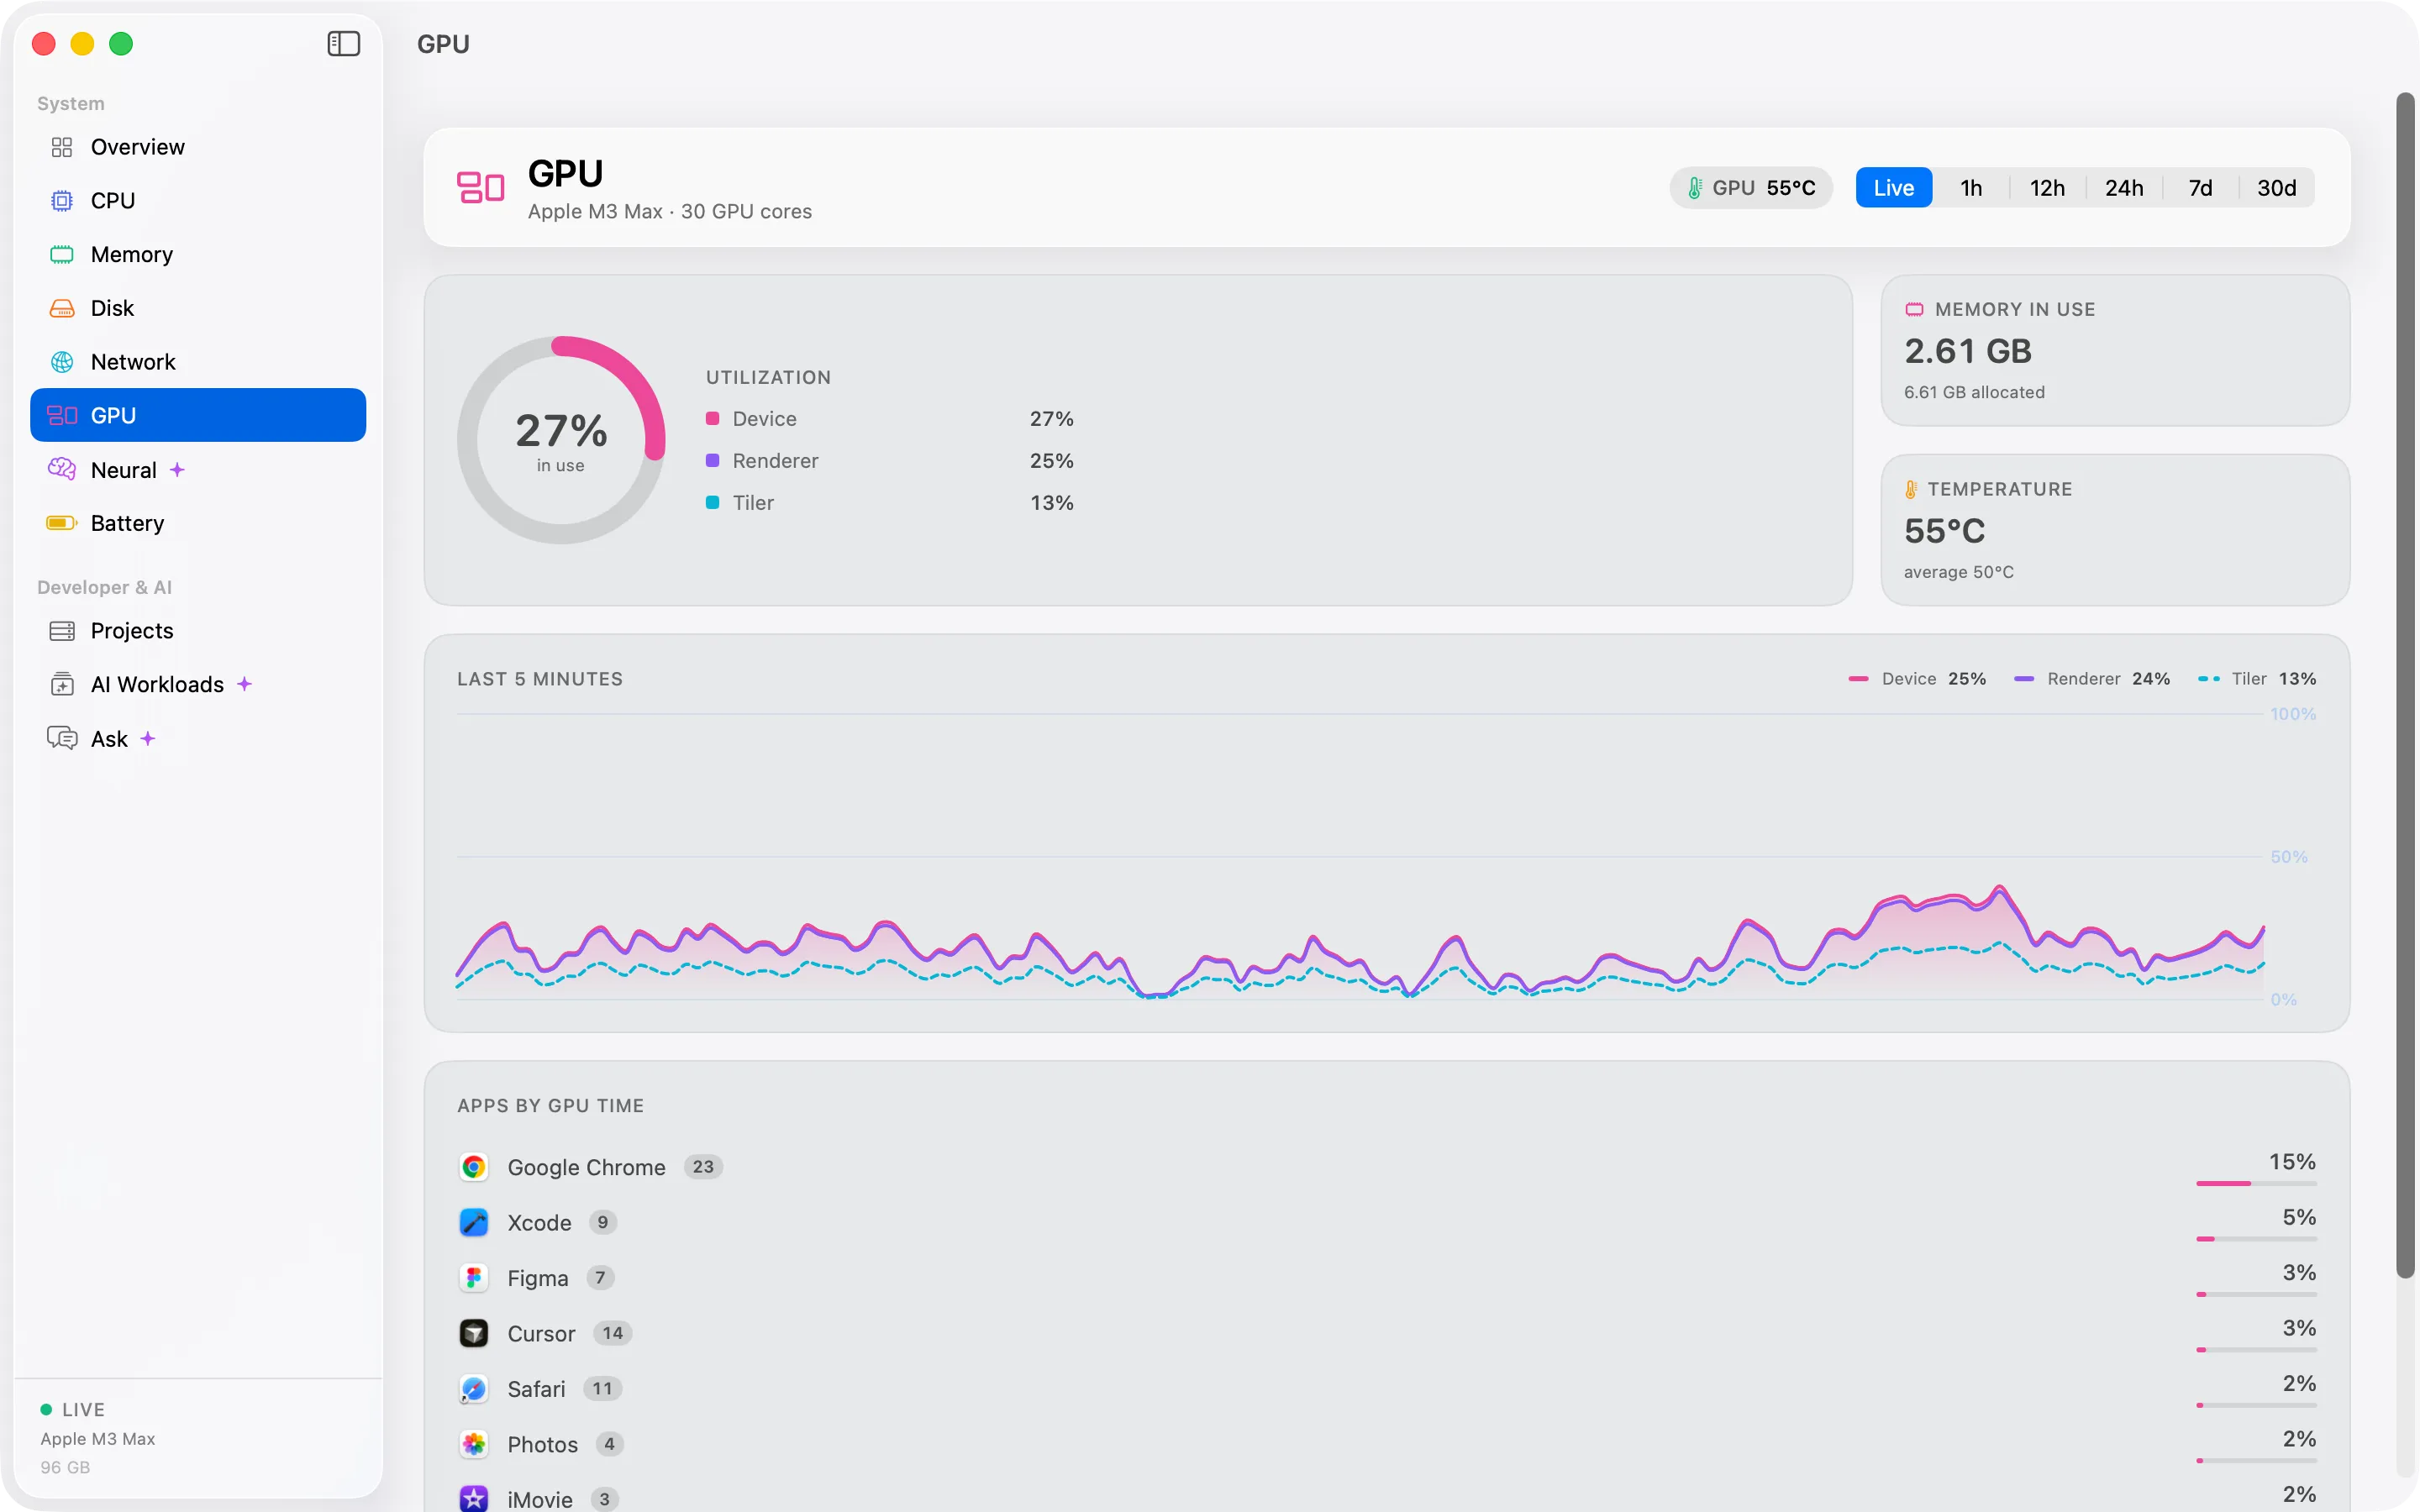
GPU load and the apps behind it, with the same 30 days of history as everything else.

Games, video exports and local models all lean on the GPU. Cortex shows how hard it is working, and for whom.

  • GPU load over time
  • Per-app GPU use
The Cortex GPU screen showing GPU load over the last hour.The Cortex GPU screen showing GPU load over the last hour.

Battery

Battery, temperatures and fans

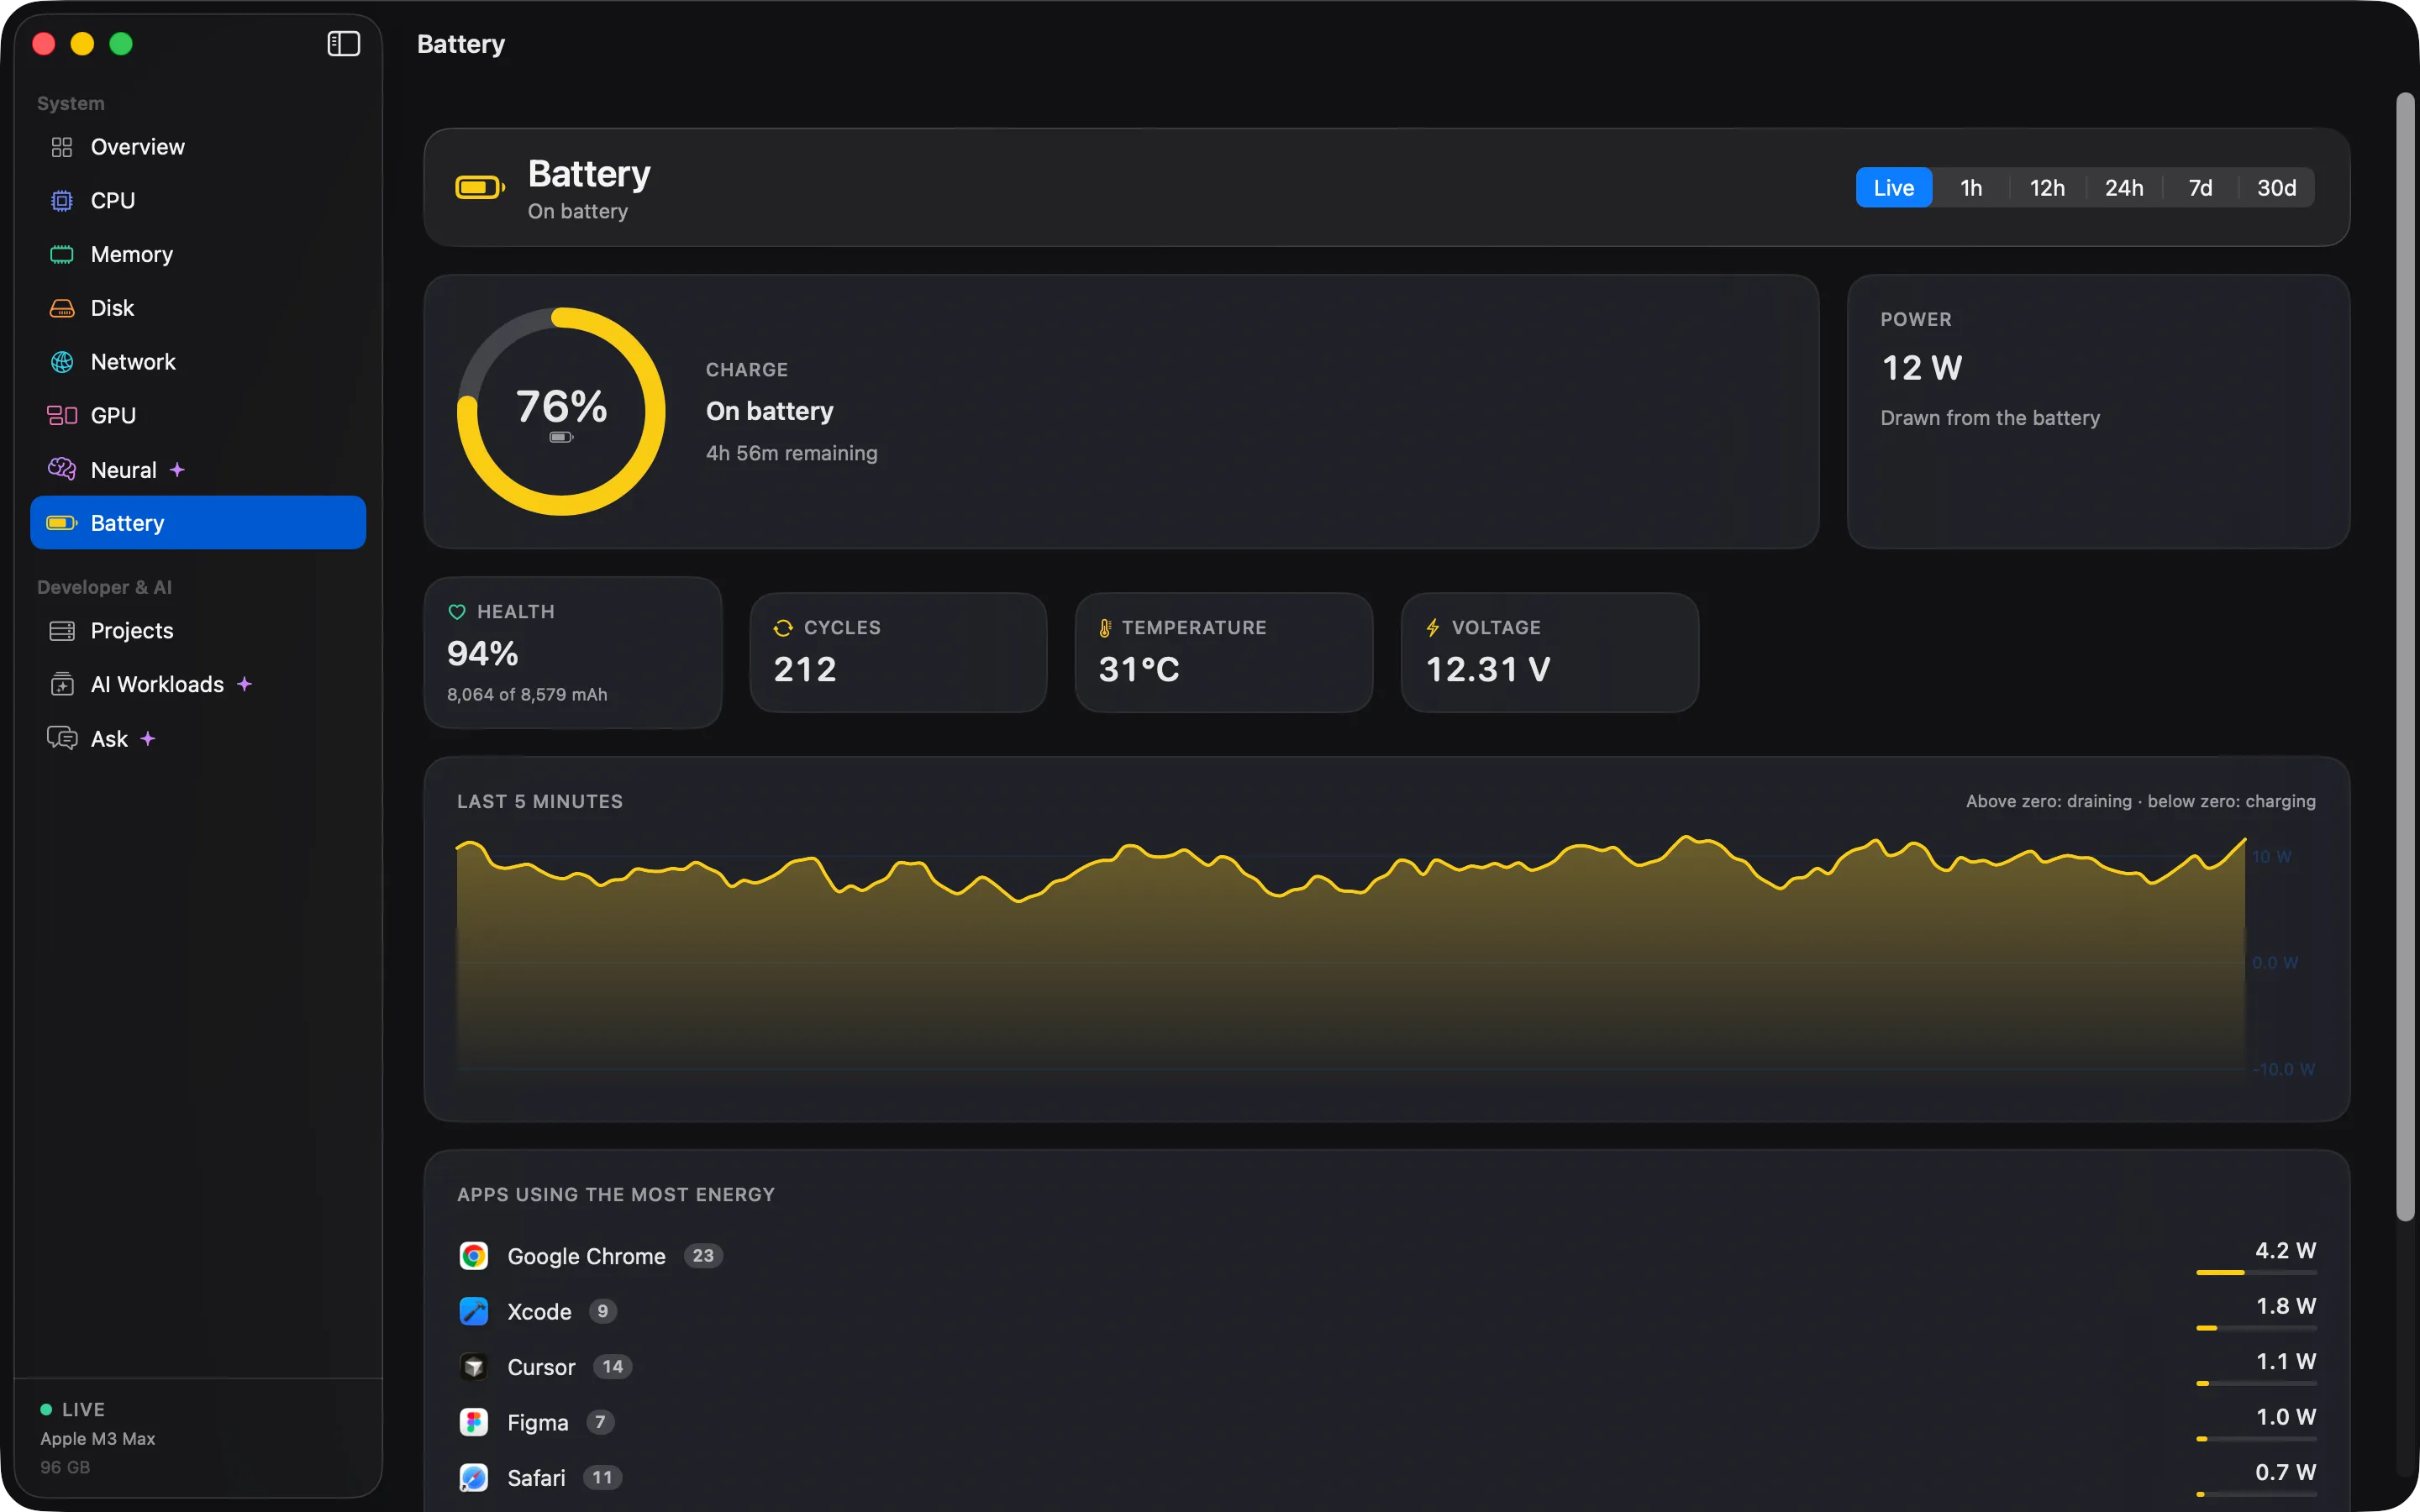
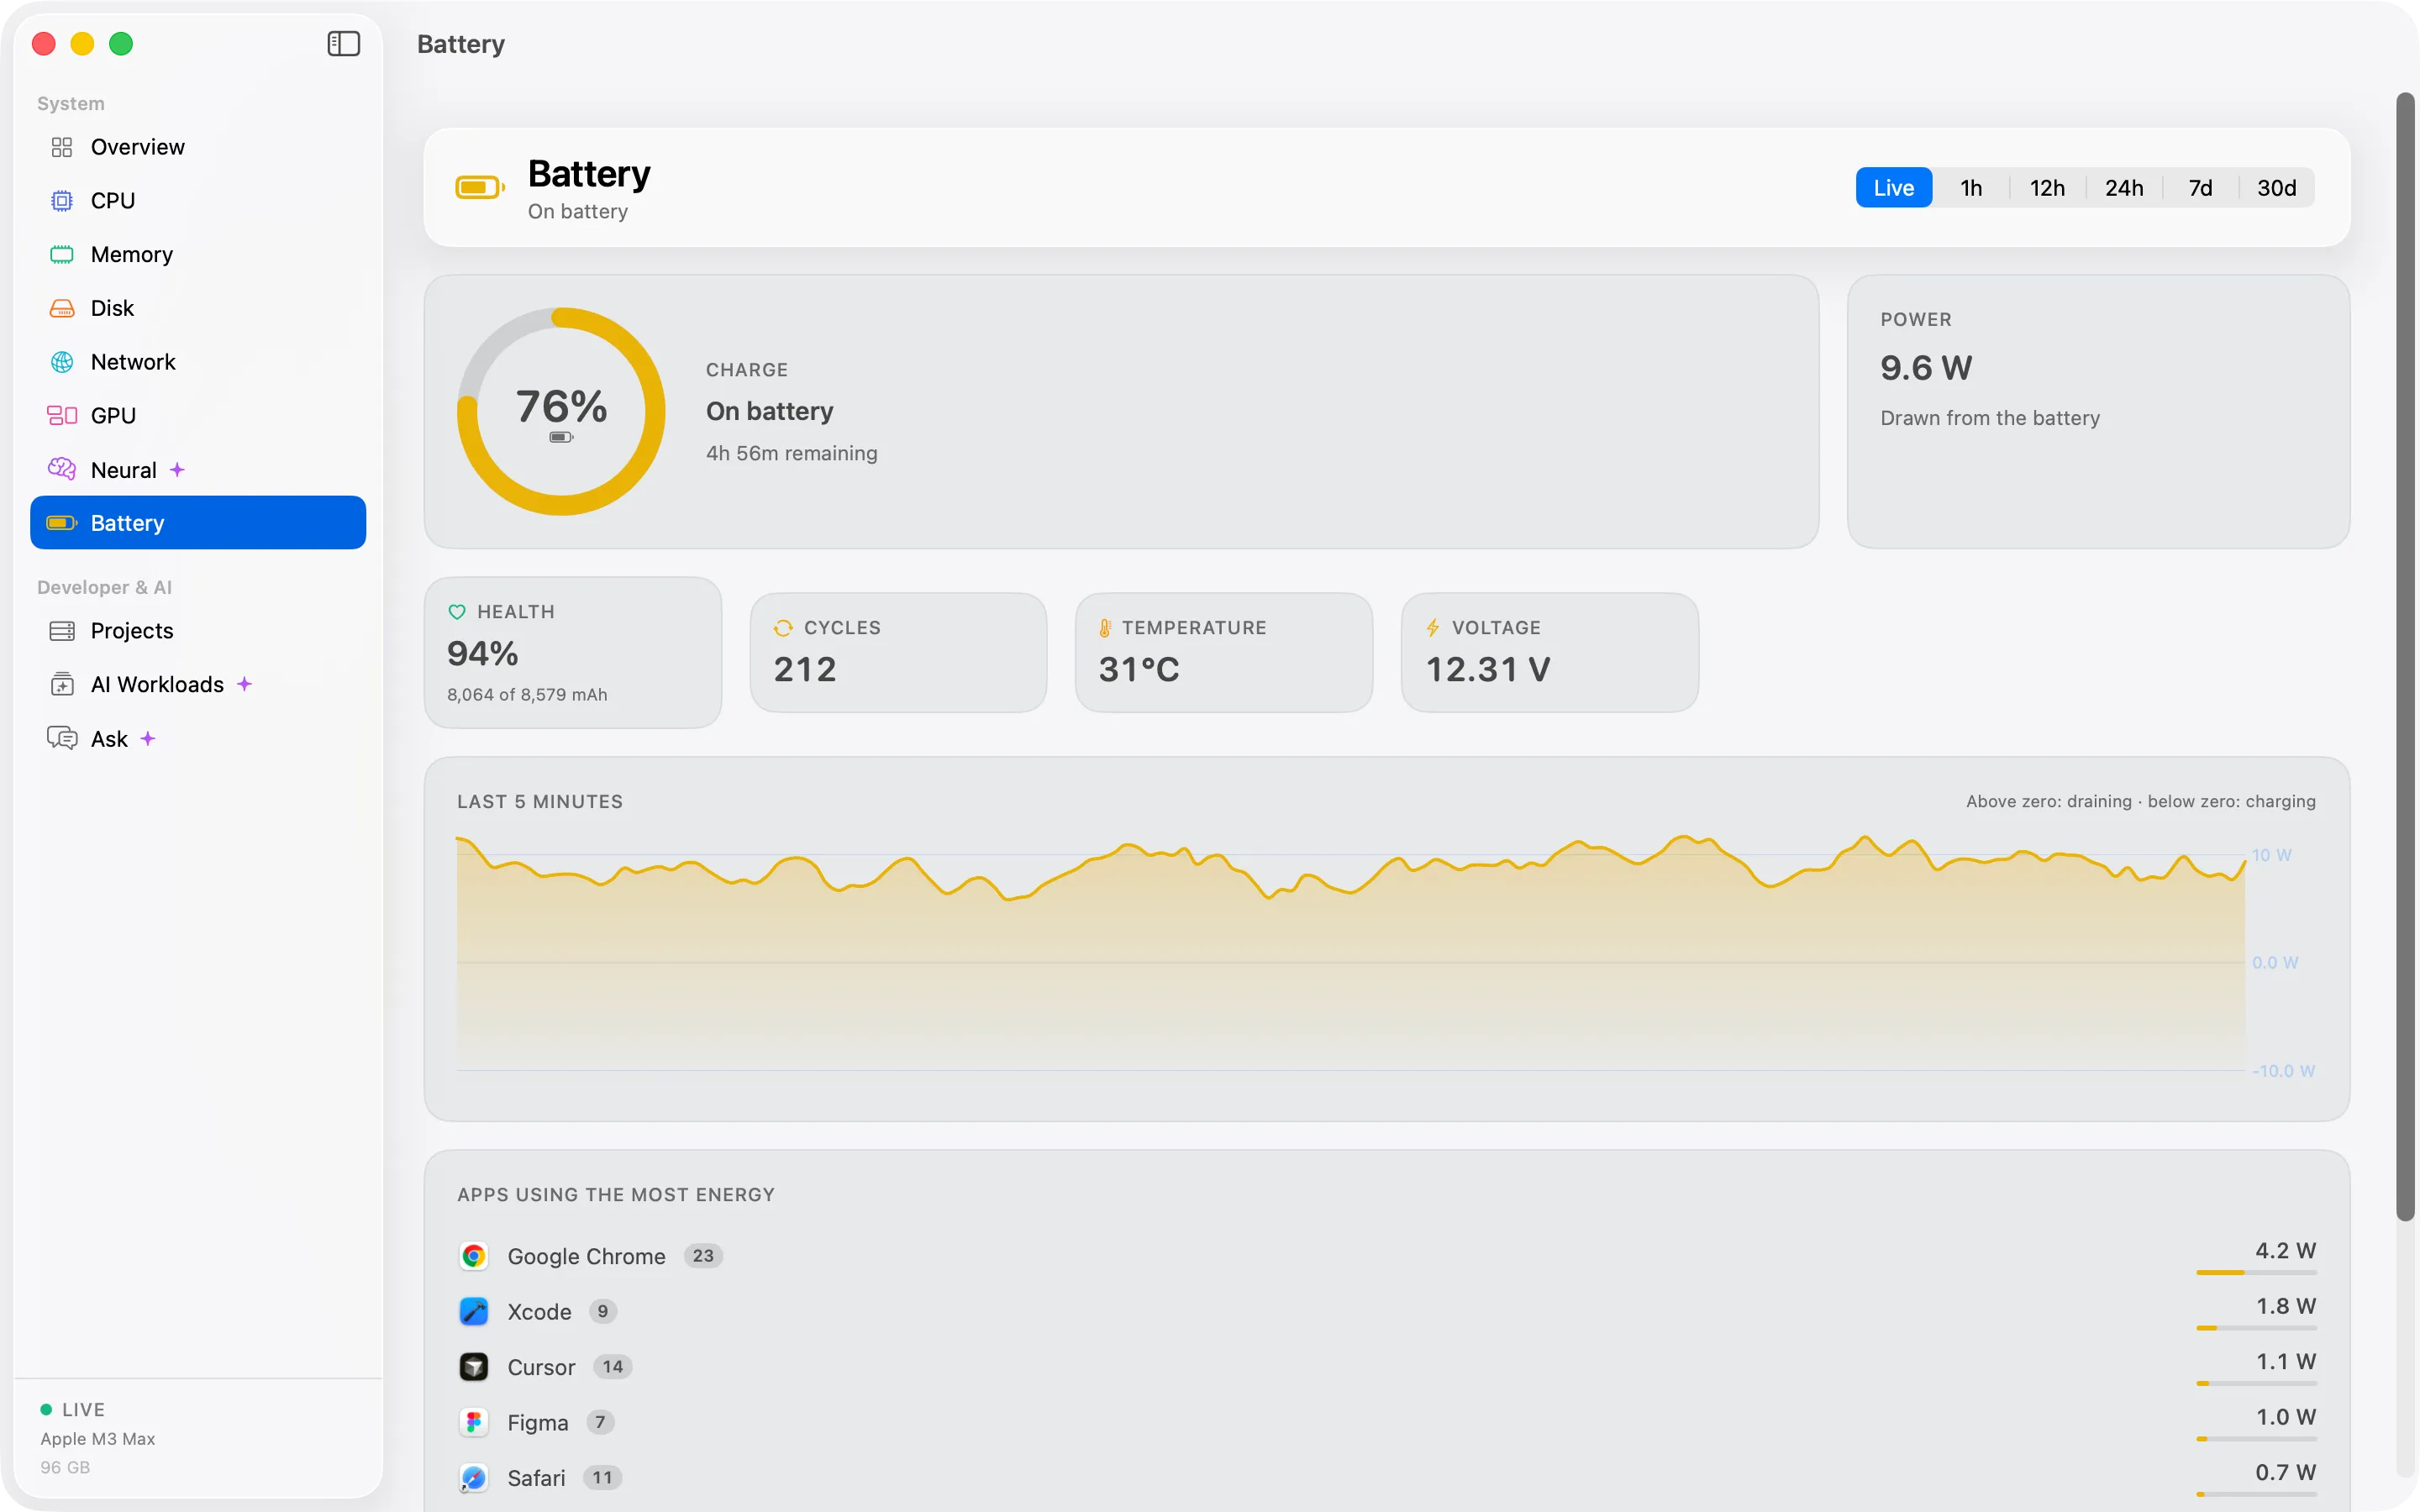
Battery health, cycle count and power draw, with temperatures and fan speeds alongside.

Find out what drained your battery, and whether the battery itself is wearing out.

  • Battery health and cycle count
  • Power draw in watts
  • Temperatures and fan speeds
The Cortex battery screen showing battery health, cycle count and power draw.The Cortex battery screen showing battery health, cycle count and power draw.

Benchmark

Silicon Probe

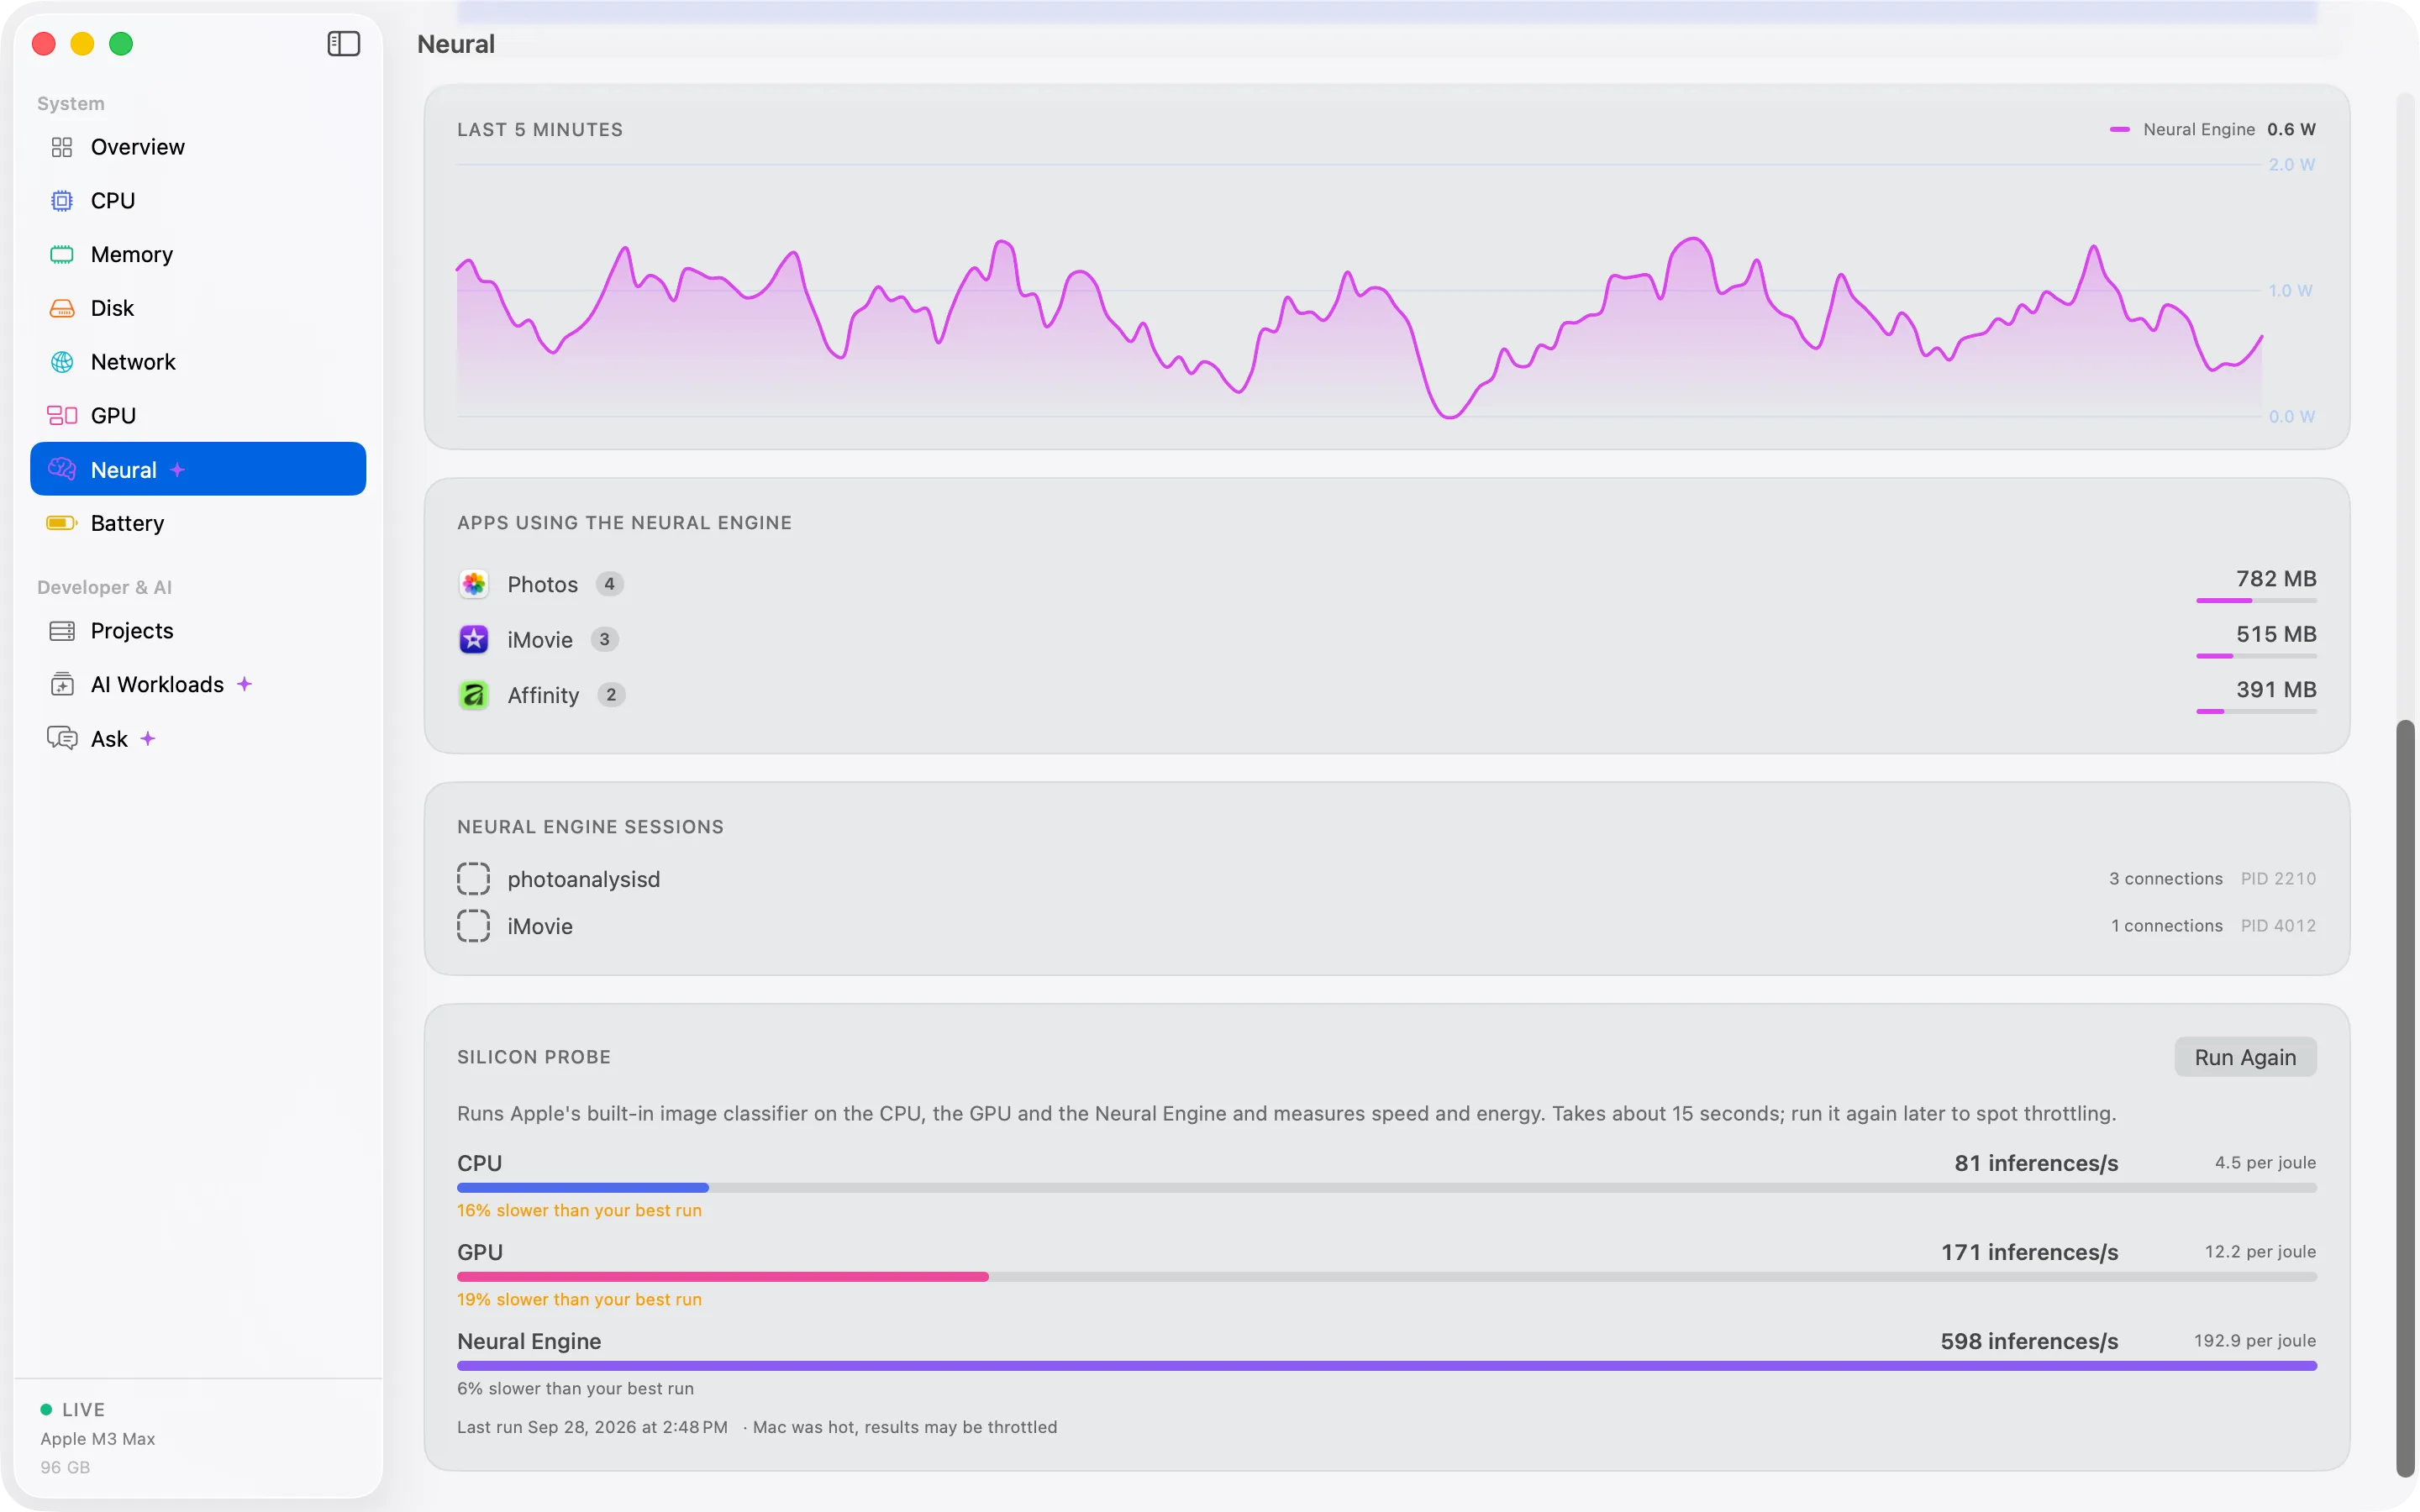
A short benchmark of the CPU, GPU and Neural Engine, tracked over time on your own Mac.

Run the probe after a macOS update, or when the Mac feels slower than it used to. Your results are compared with your own earlier runs.

  • CPU, GPU and Neural Engine
  • Results tracked over time
Silicon Probe results for CPU, GPU and Neural Engine, compared with earlier runs.Silicon Probe results for CPU, GPU and Neural Engine, compared with earlier runs.
04

Built into your day

For developers, for the menu bar, and for the end of the day.

For developers

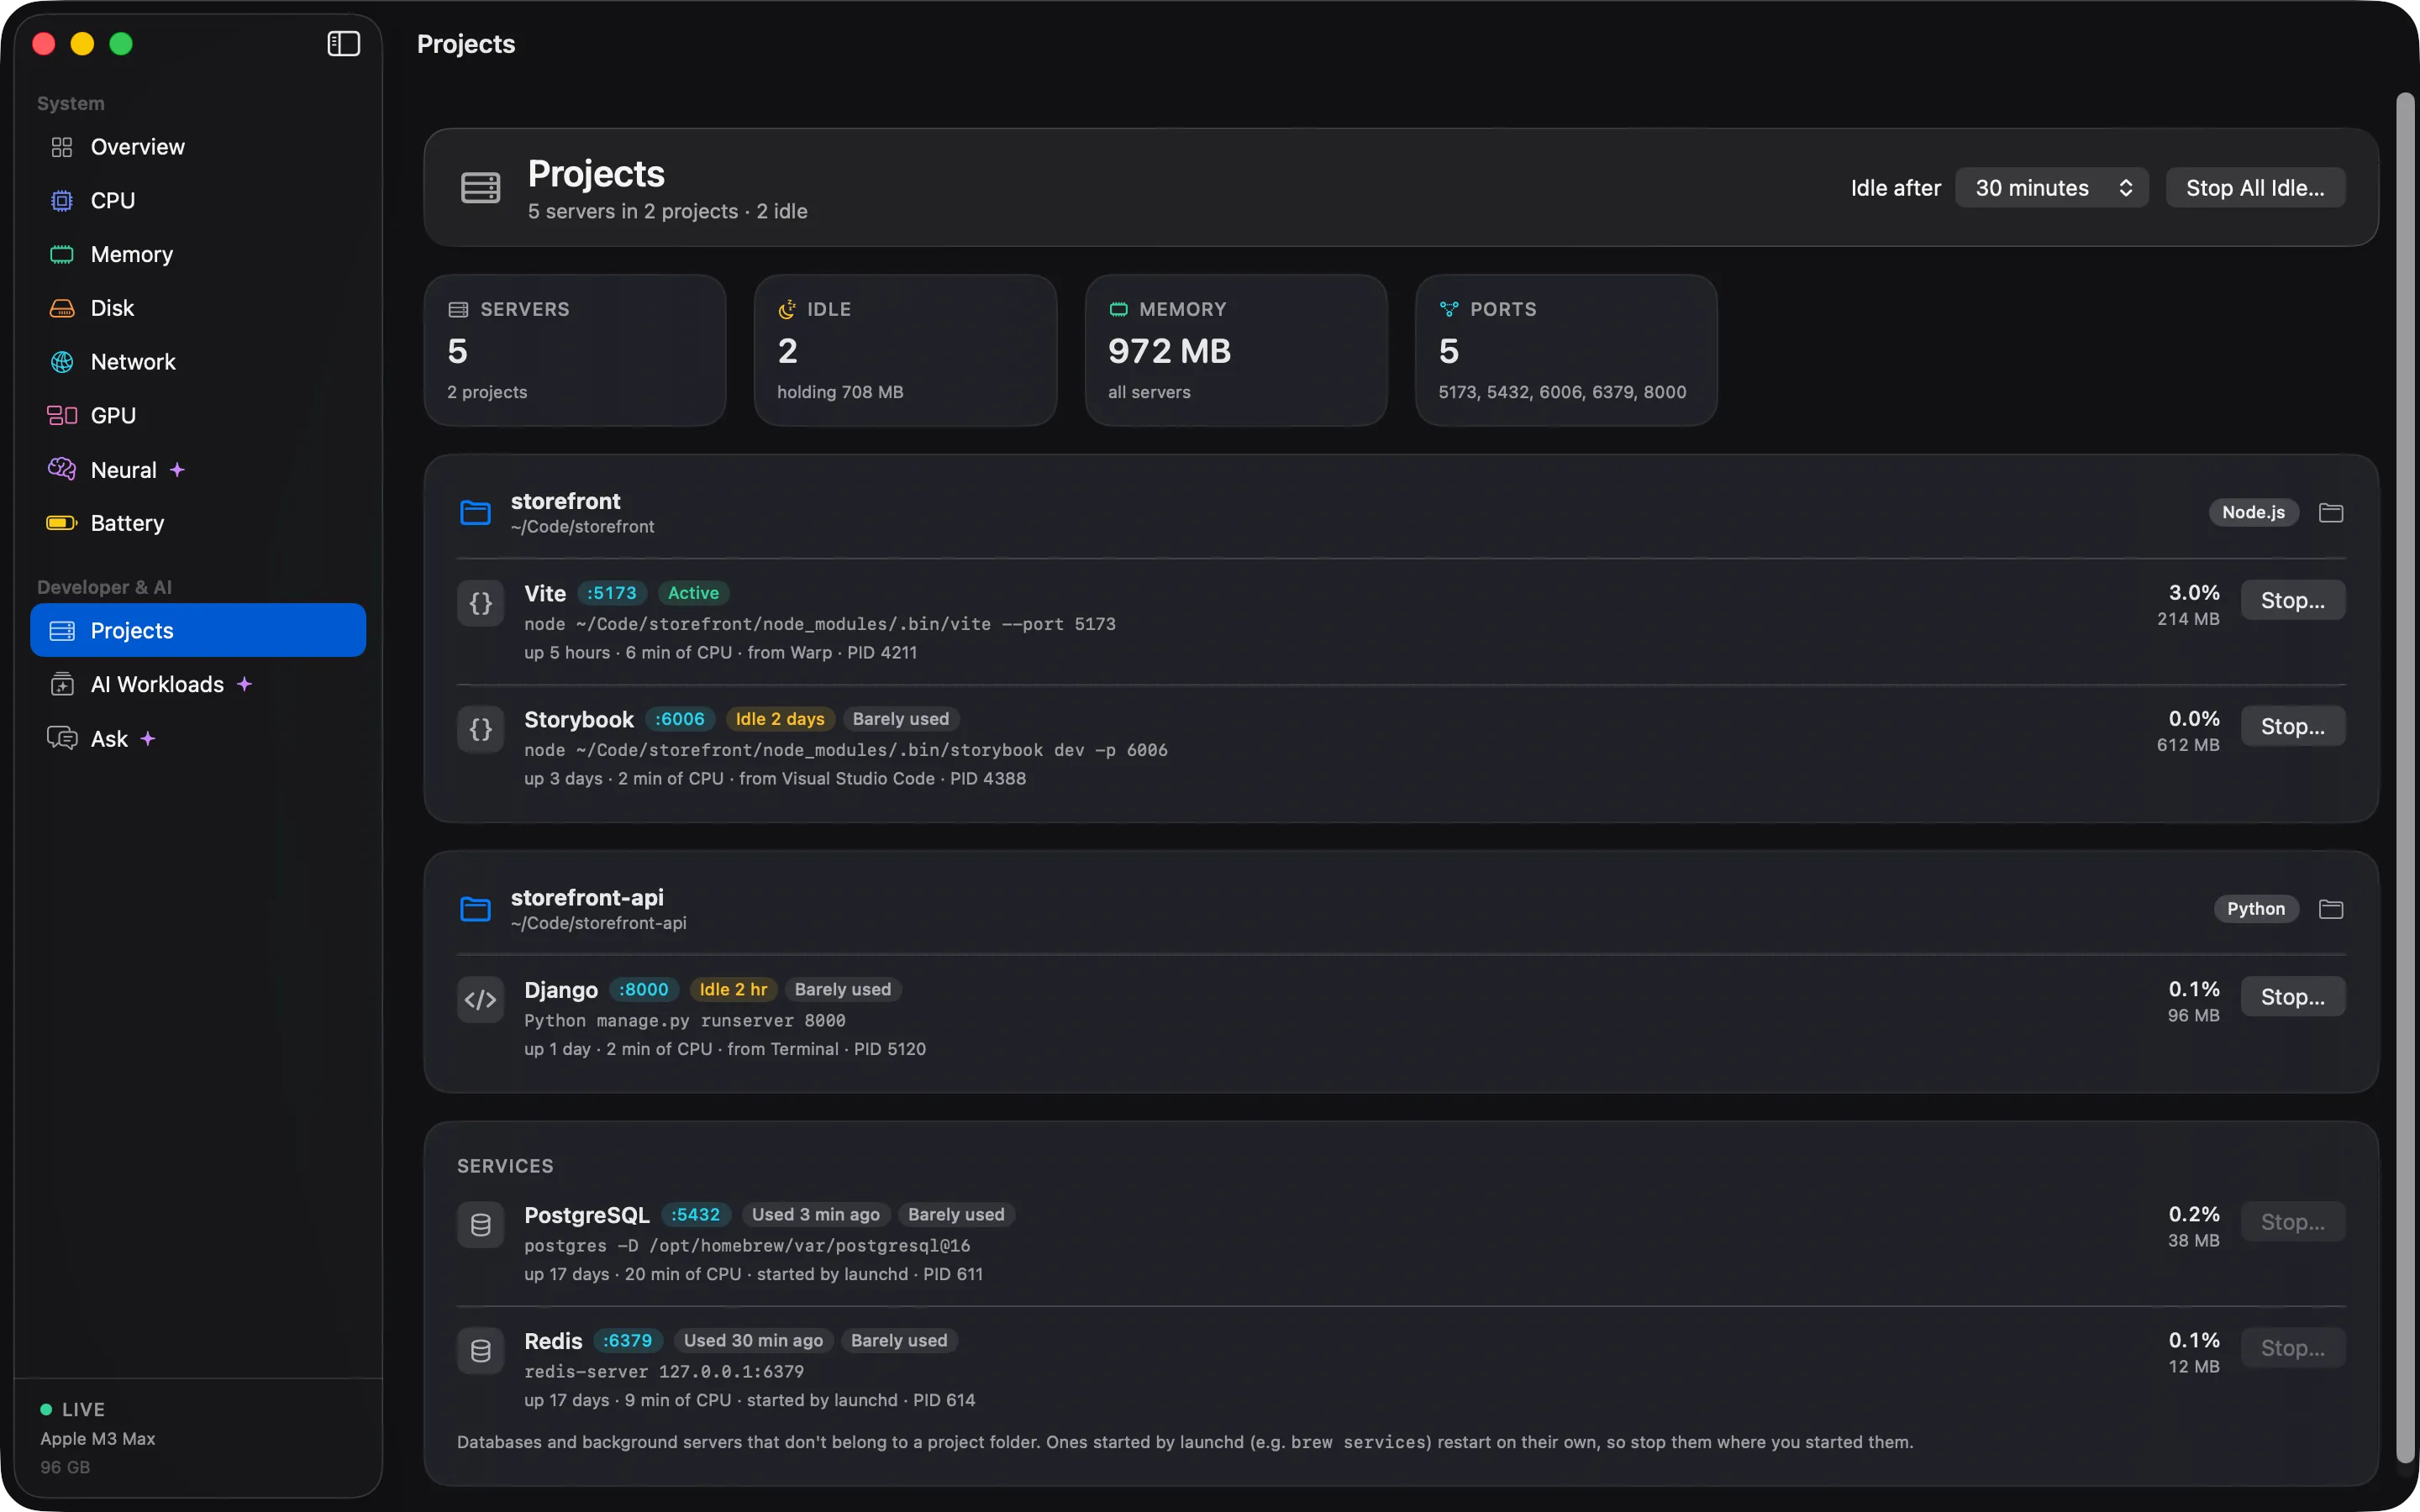
Projects

Dev servers on listening ports, grouped by project. Find the one you forgot three days ago.

Every project leaves something running. Cortex groups listening servers by project, shows how long they have been up, flags the idle ones, and stops them when you ask.

  • Node, Bun, Deno, Python, Go, Ruby, Java and Docker
  • Port, uptime and idle detection
  • Stop a server, with confirmation
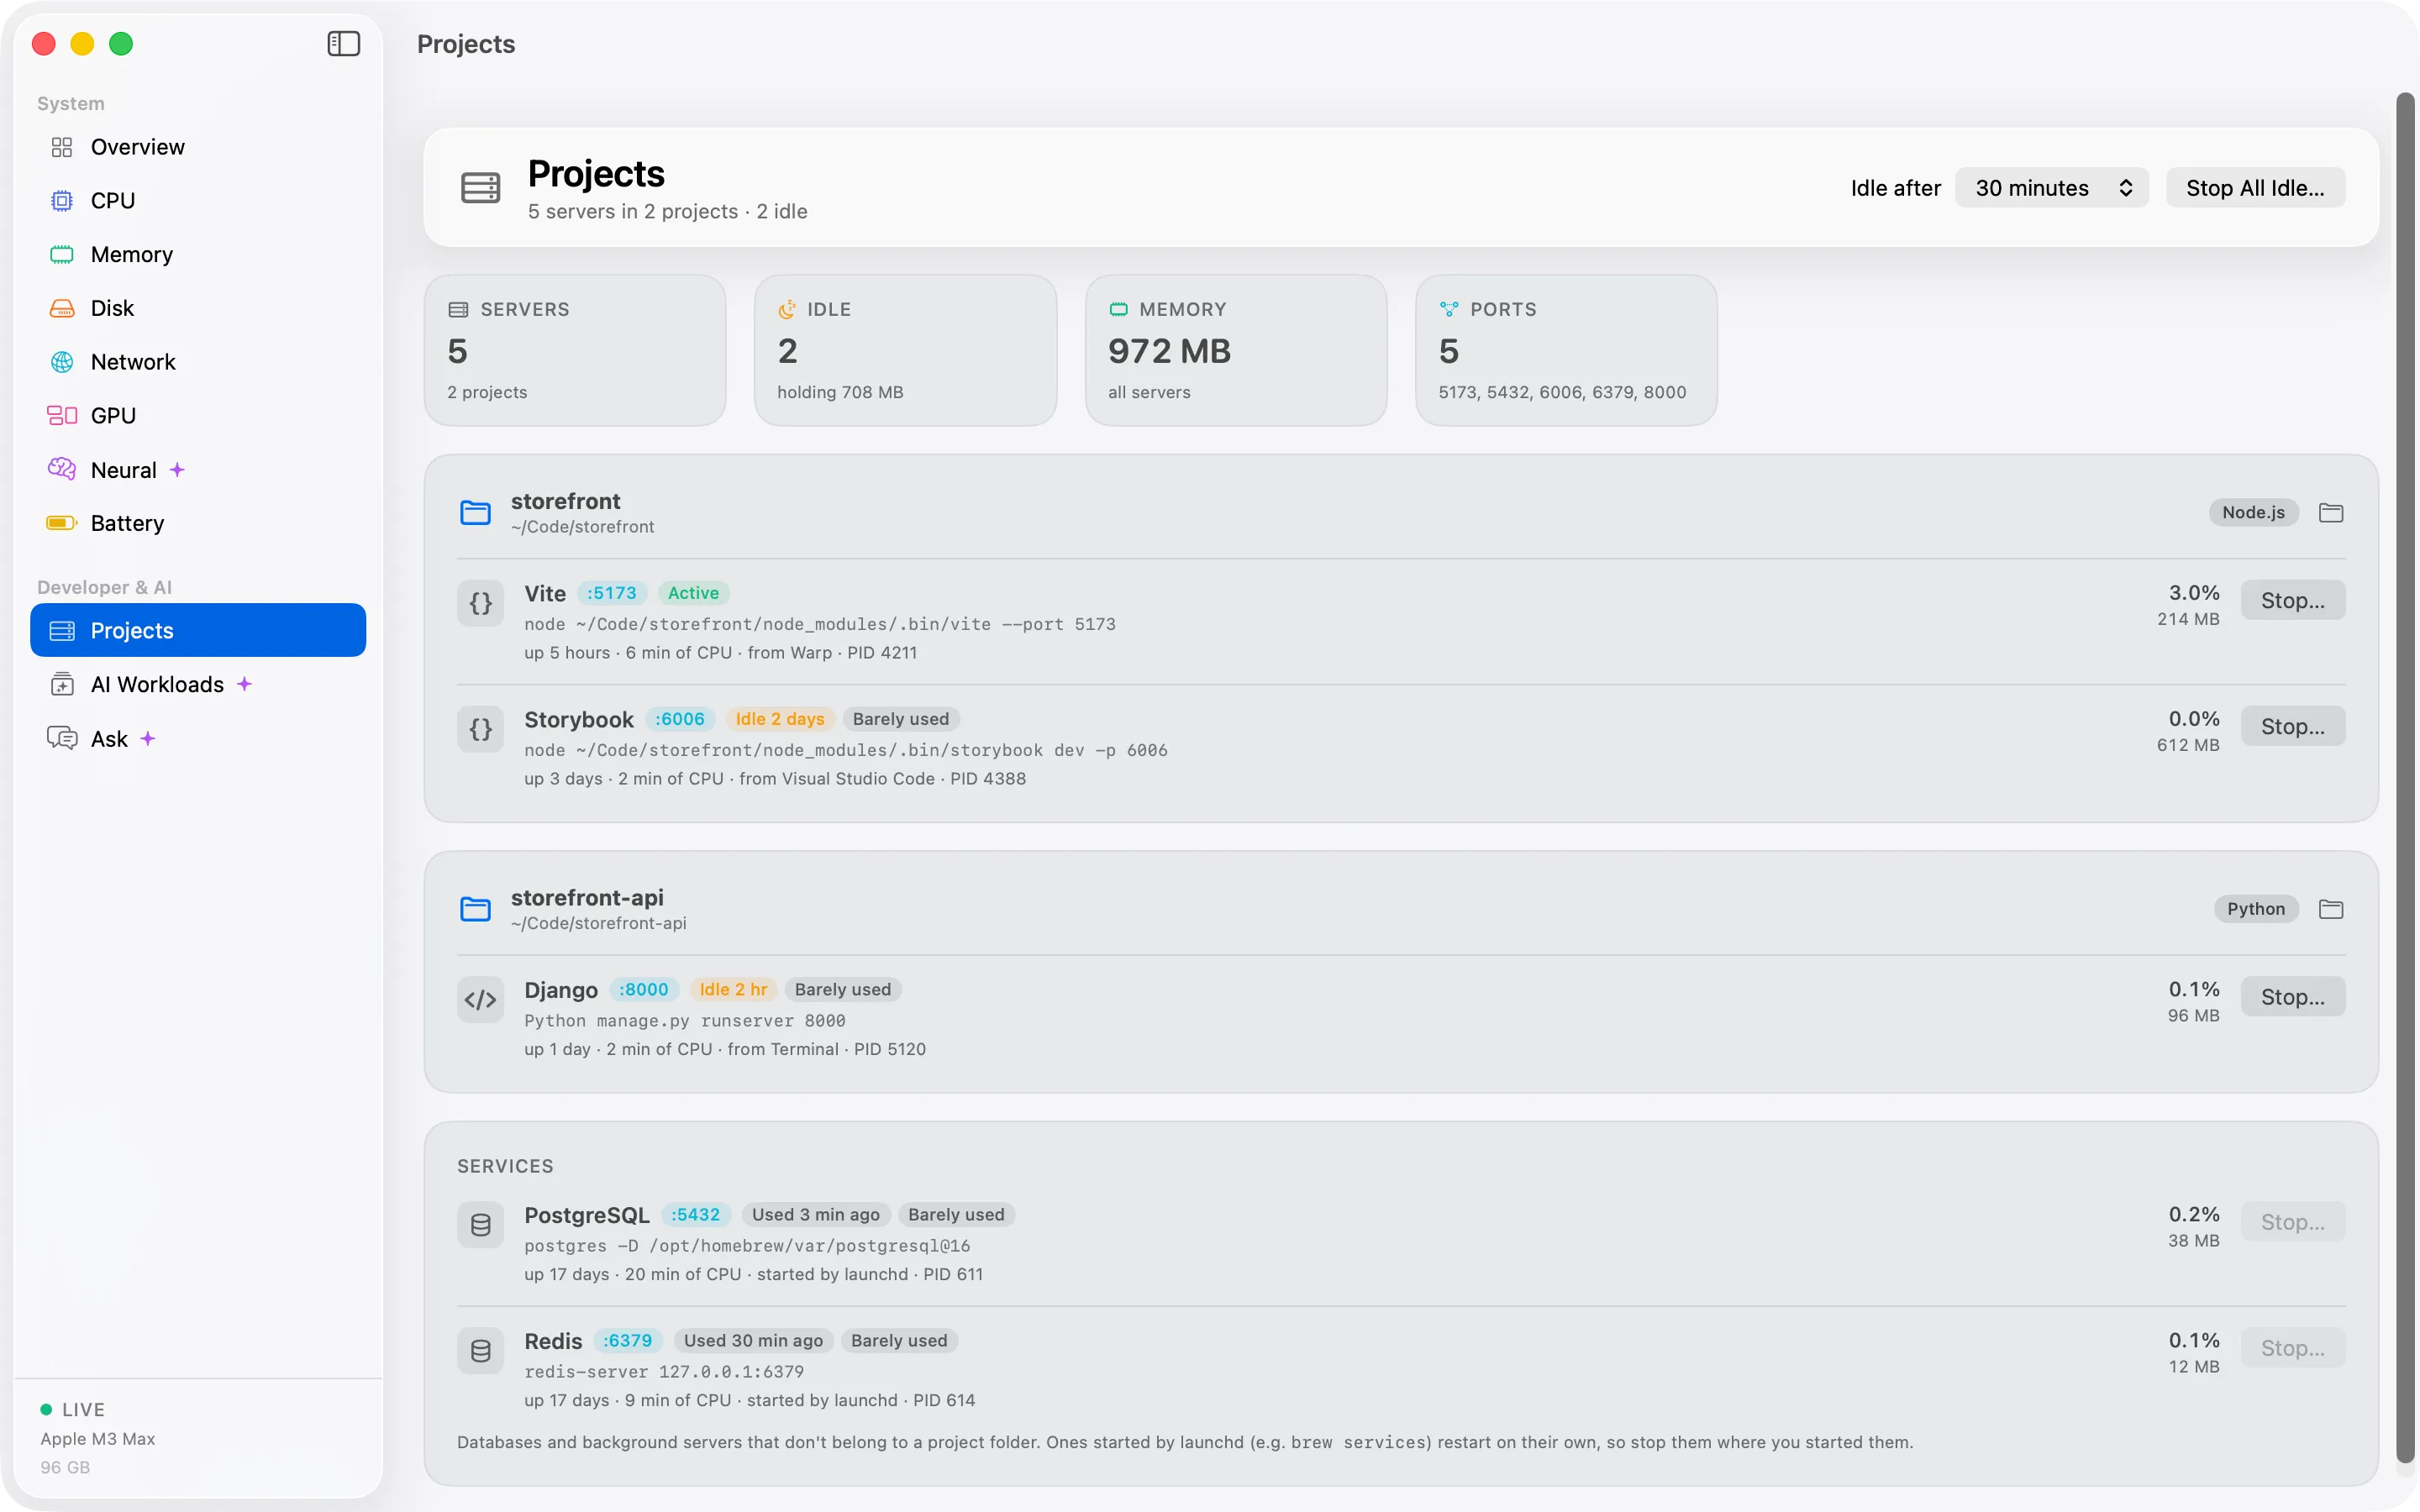
The Cortex Projects screen listing dev servers grouped by project, with their ports and uptime.The Cortex Projects screen listing dev servers grouped by project, with their ports and uptime.

Digest

Daily digest

Each evening, a short summary of your Mac's day.

One notification a day, with the few facts worth knowing.

  • Top energy app and busiest hour
  • Idle dev servers
  • Hours of local AI work
The Cortex daily digest showing the top energy app, the busiest hour and idle dev servers.The Cortex daily digest showing the top energy app, the busiest hour and idle dev servers.

Share

Share card

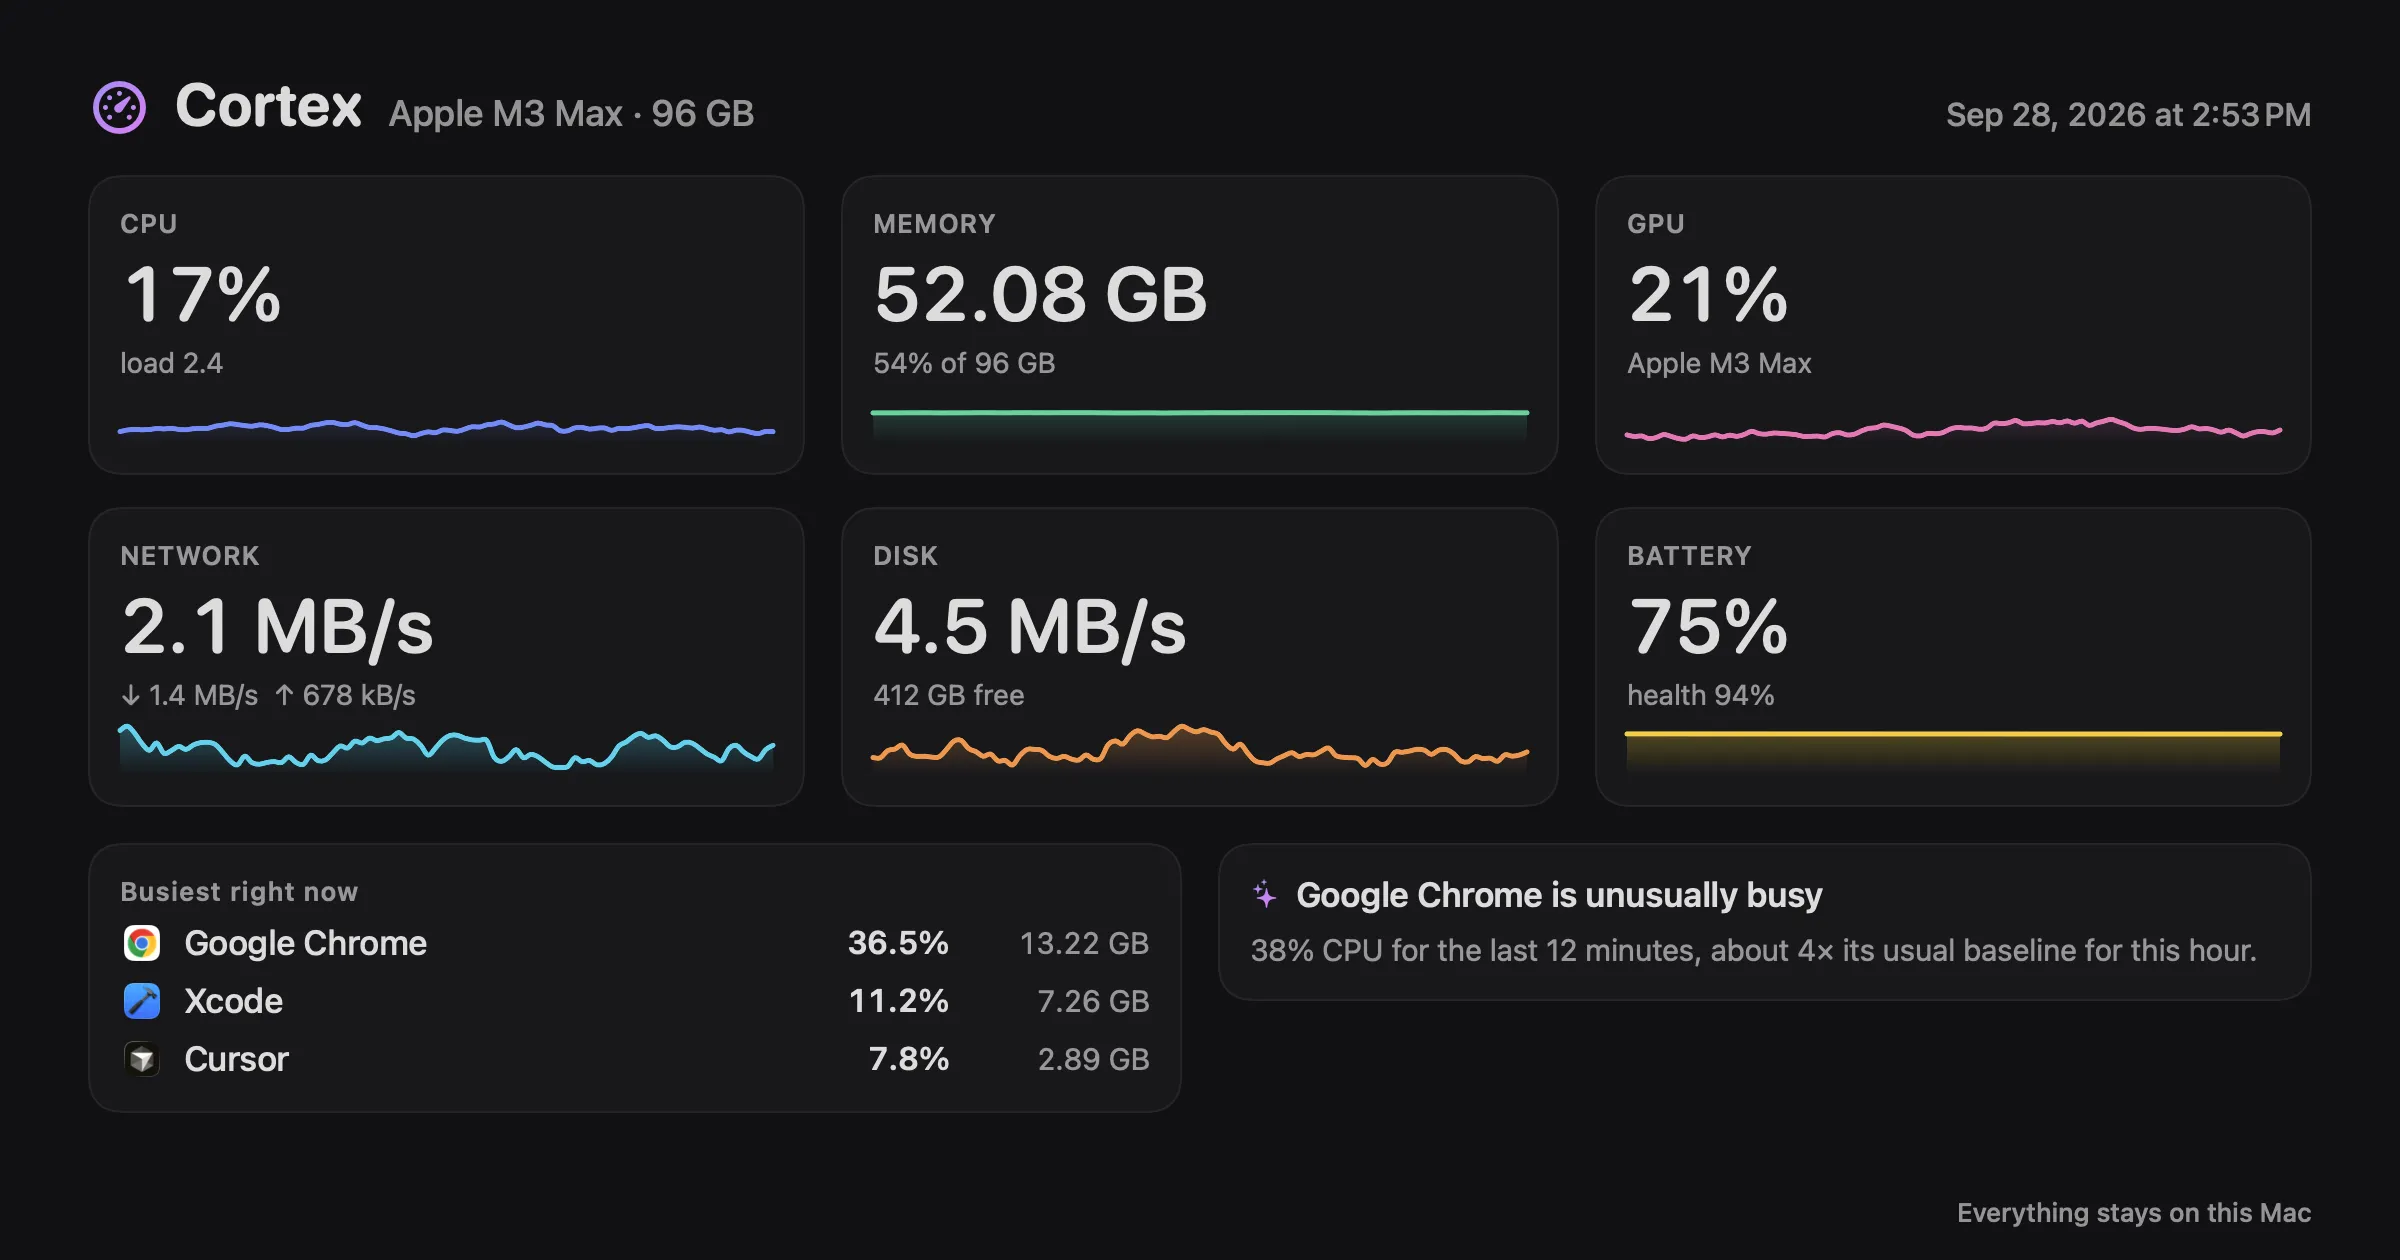
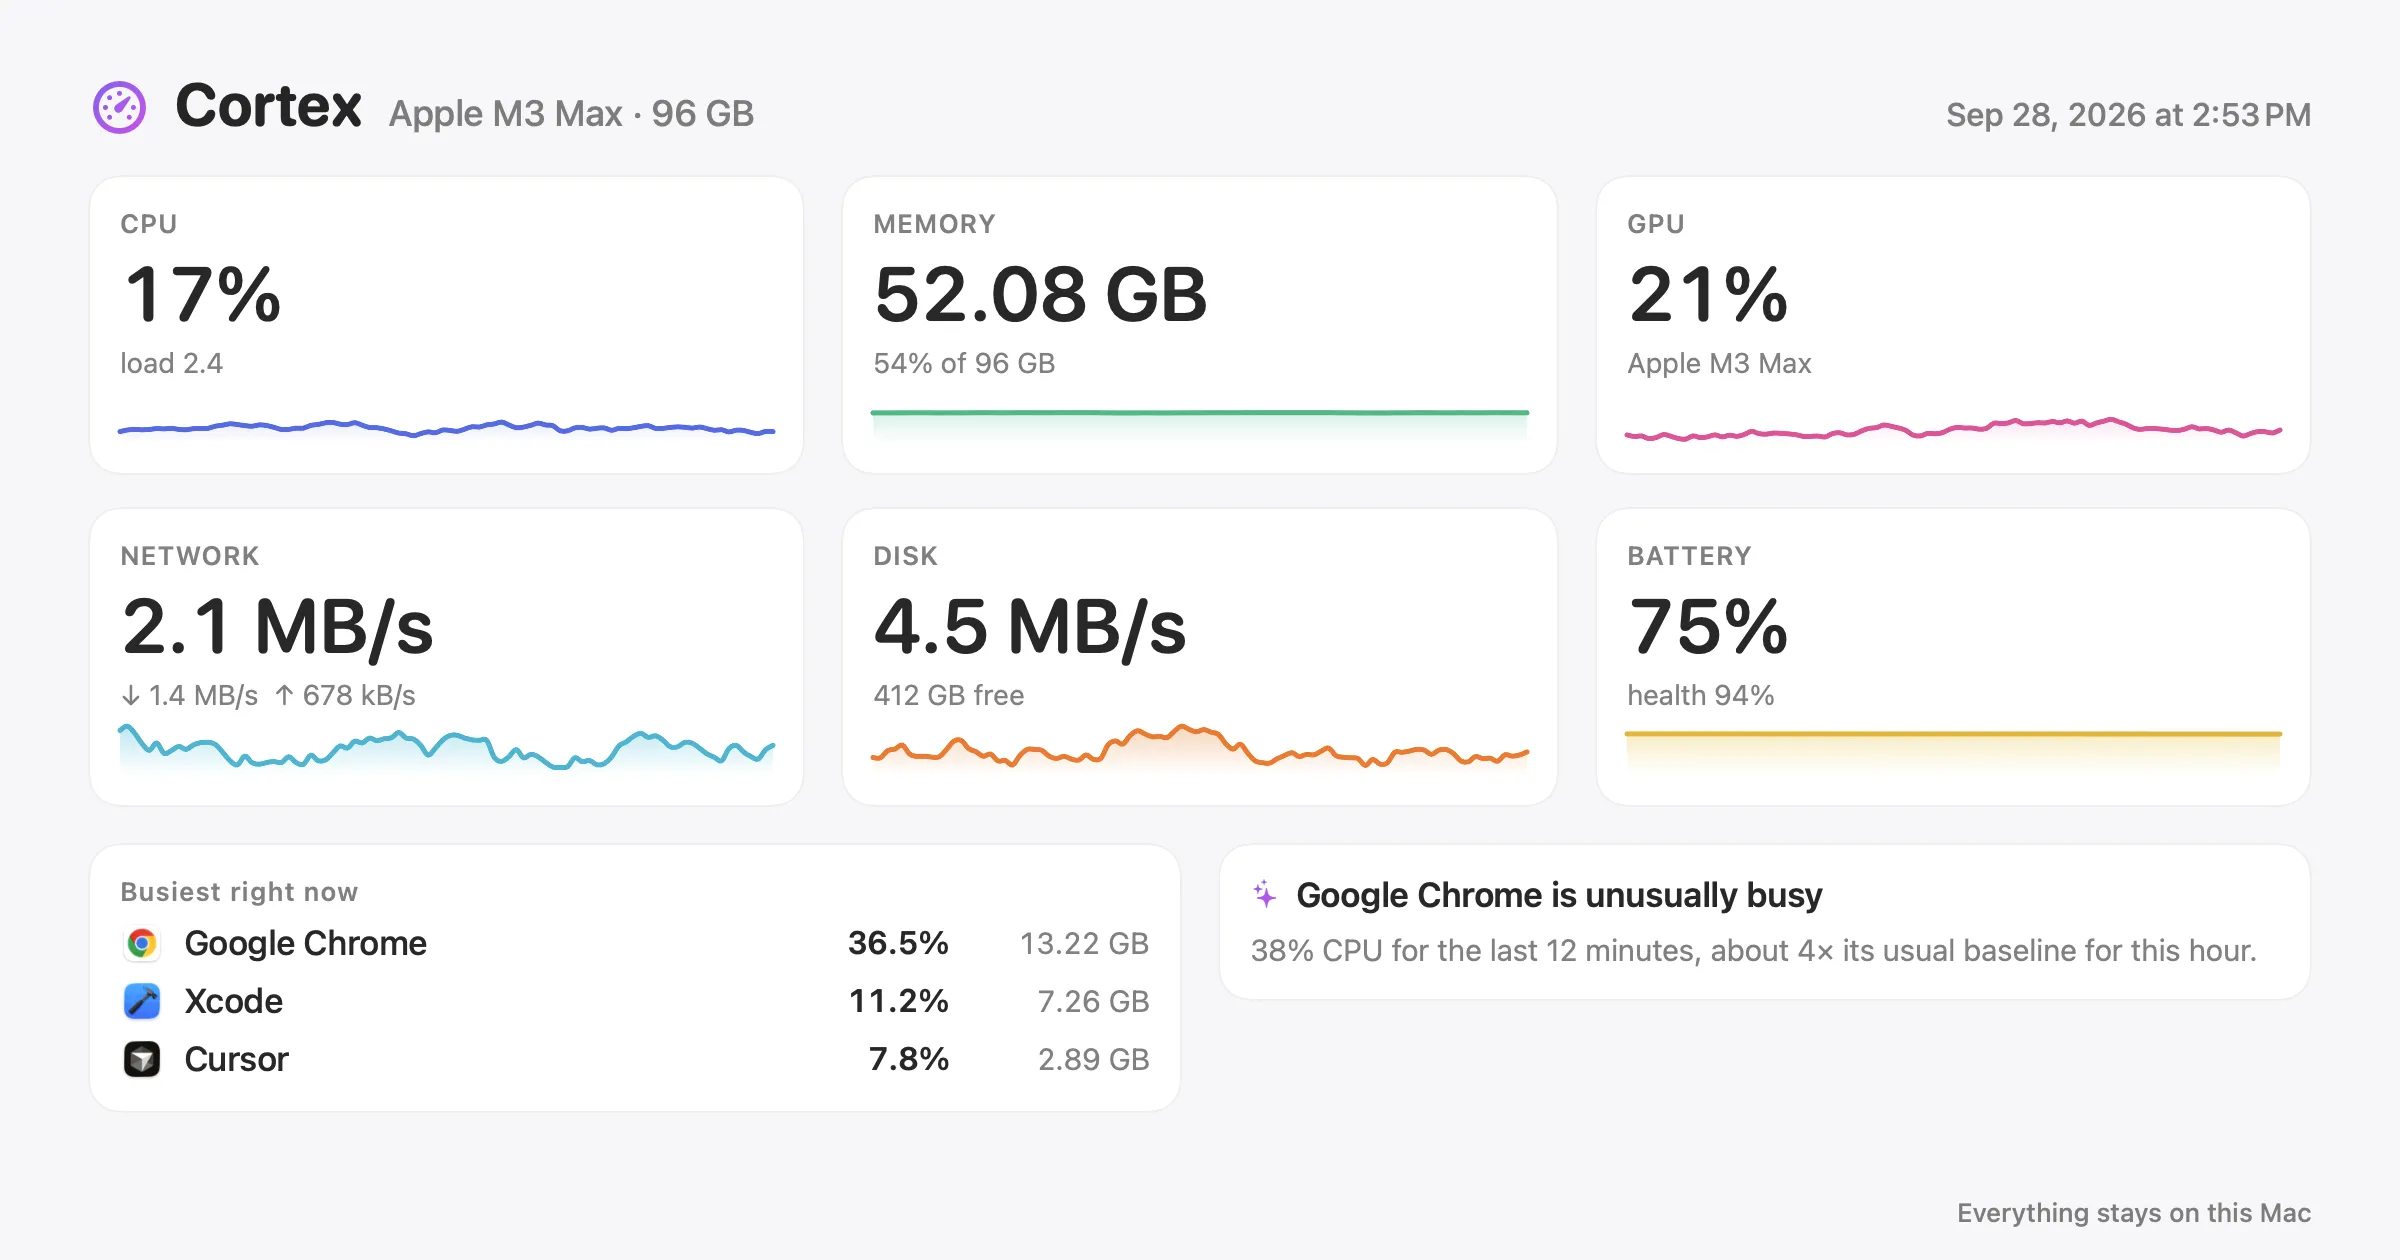
Export a 2400 × 1260 image of your dashboard, in light or dark.

For a bug report, a team chat or a post about your setup.

  • 2400 × 1260 pixels
  • Light or dark
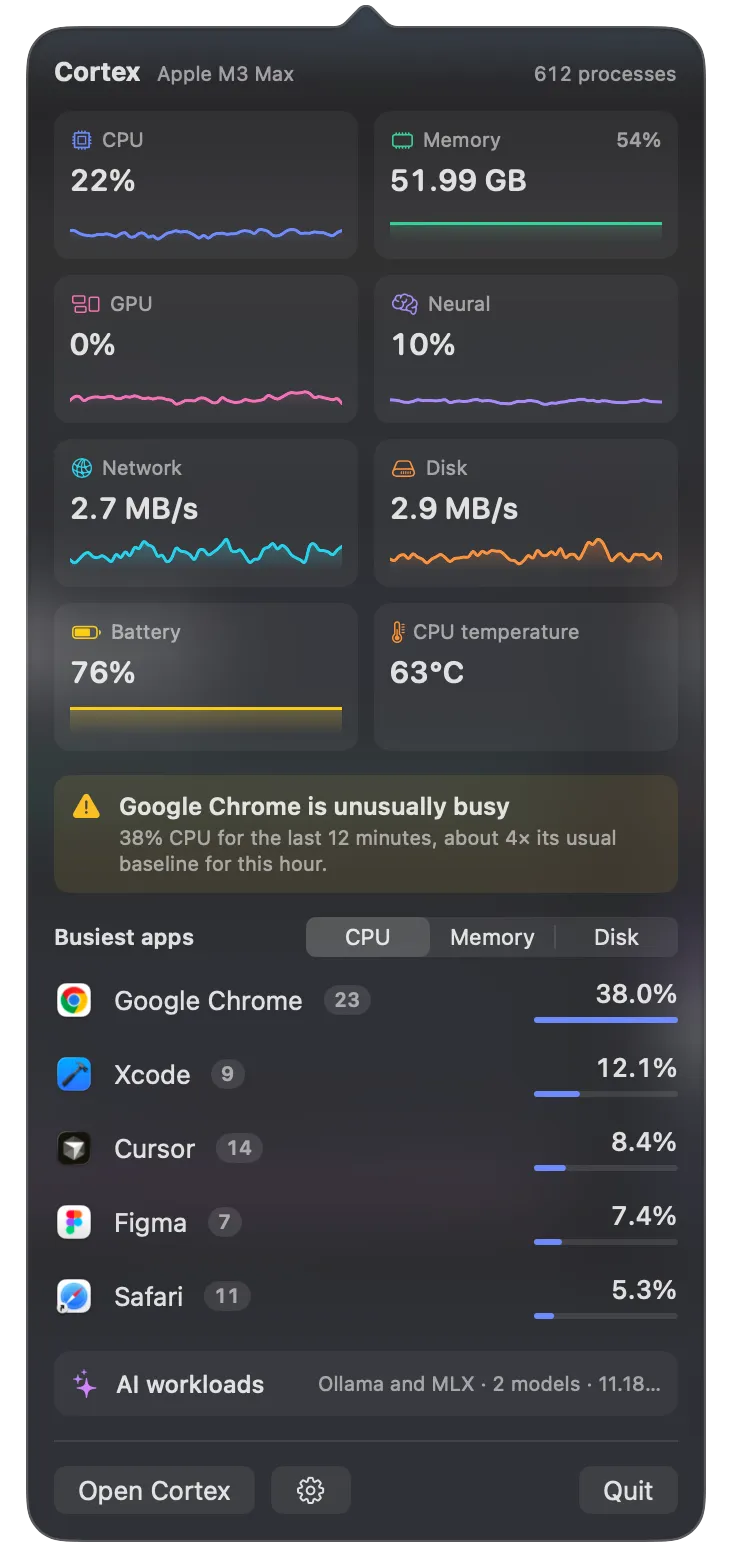
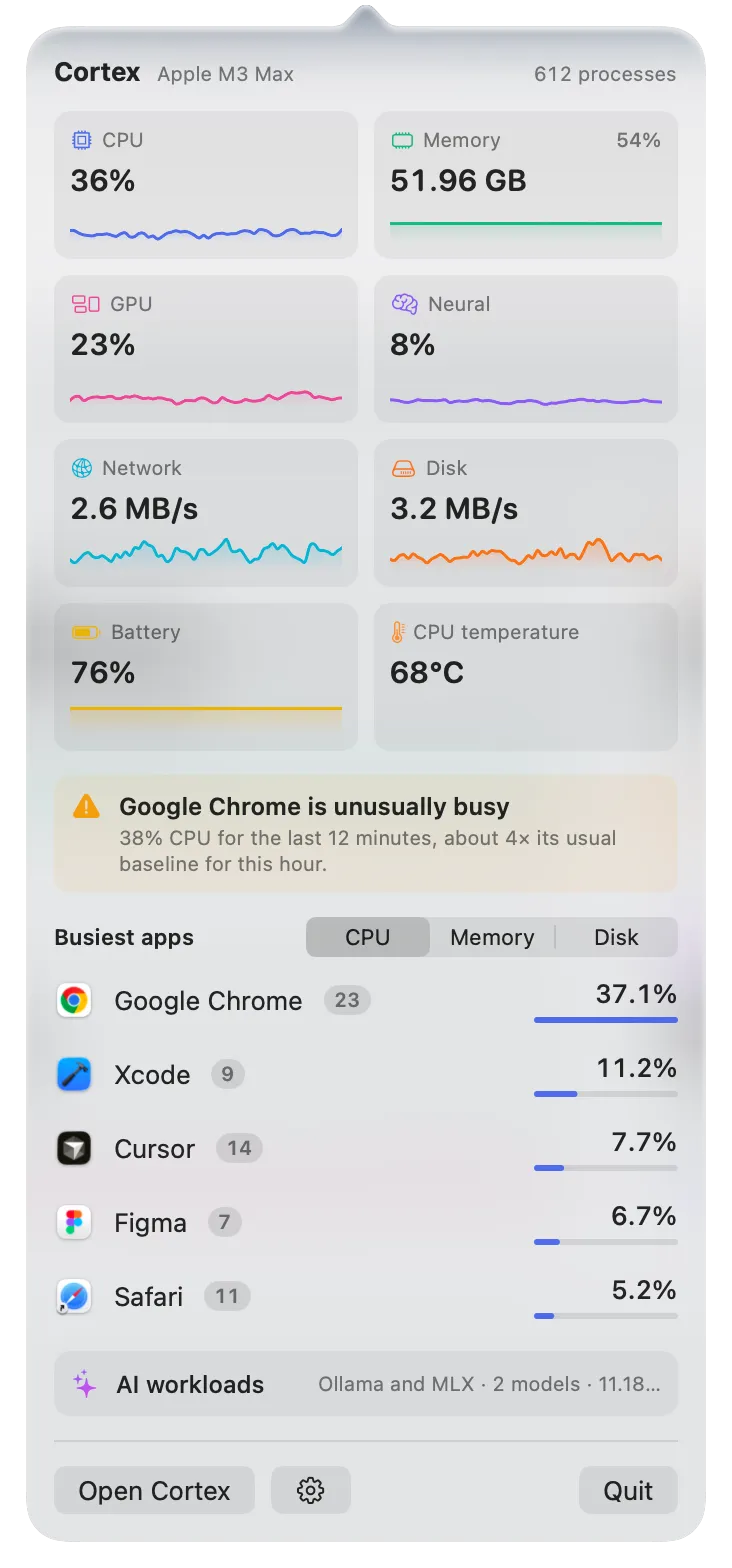
A Cortex share card image summarising a Mac's CPU, memory, GPU and Neural Engine use.A Cortex share card image summarising a Mac's CPU, memory, GPU and Neural Engine use.

Know what your Mac is doing.

Cortex, for $5. Once.

macOS 15 Sequoia or later · Apple Silicon or Intel